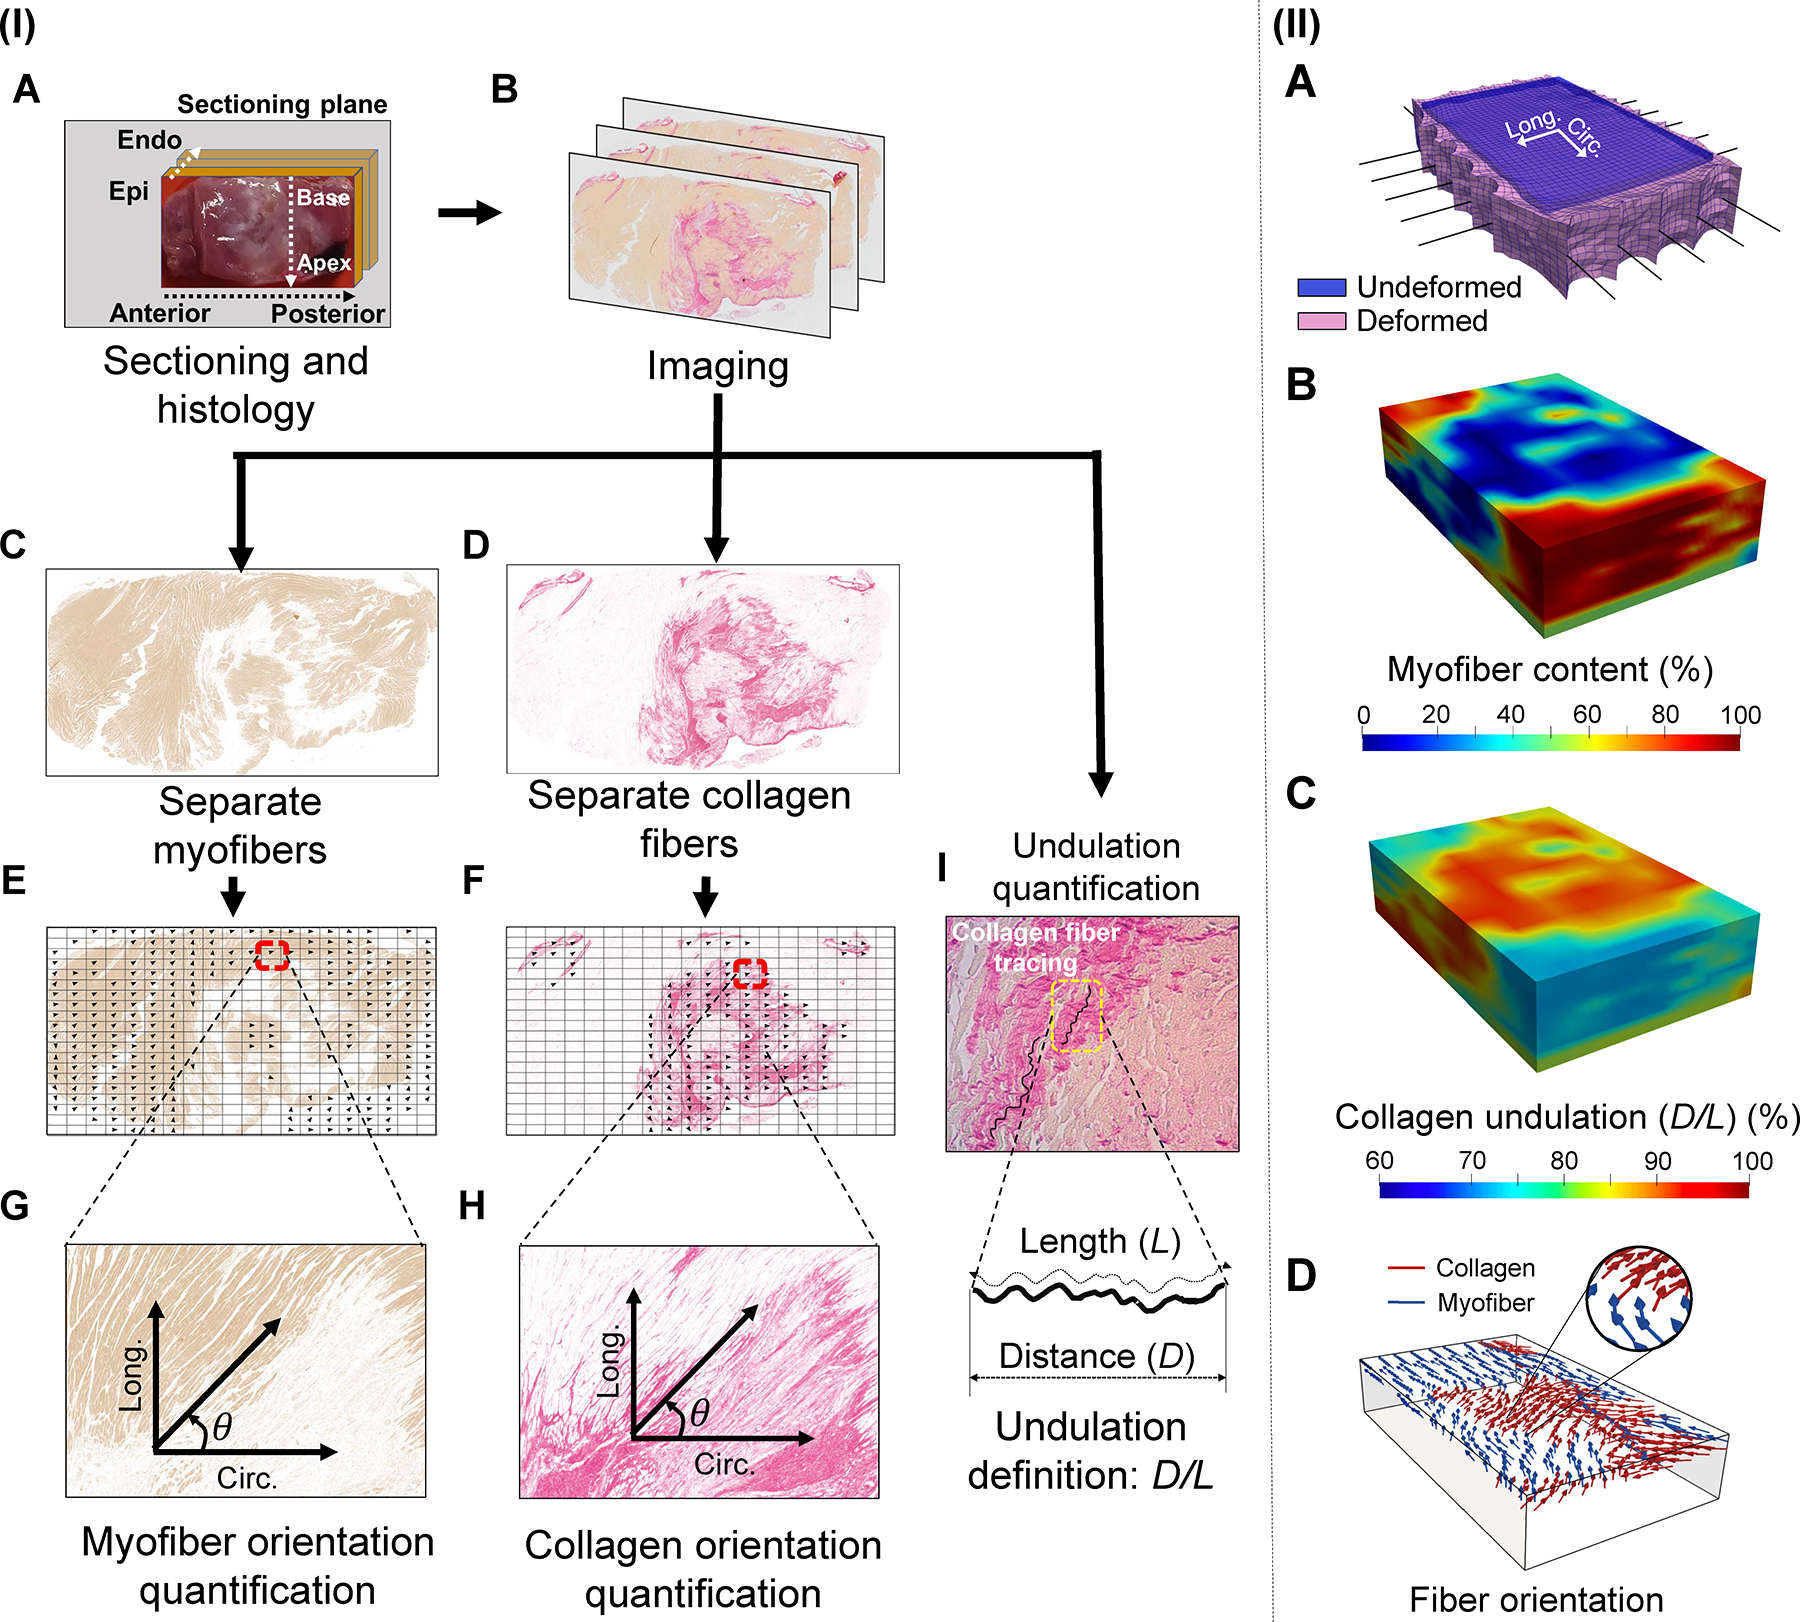
Fig. 3.

(I) Methods used to quantify fiber-level remodeling events. LVFW tissues were sectioned transmurally and stained using picrosirius red (PSR). The myofiber and collagen fiber parts of the image were separated and analyzed to obtain fiber orientation distribution. Histological slides were also imaged at a higher magnification, 40x, to quantify the amount of slack observed in collagen fibers. Representative images belong to a 3-wk post-MI specimen. (II) (A) Rat-specific in-silico LVFW model geometry at the initial (blue) and final deformed state (pink) once displacements were applied to the simulated rakes (black line elements). (B) Representative visualization of the 3-D spatial myofiber content and (C) collagen undulation data incorporated into the in-silico model. (D) Representative visualization indicating the regional myofiber (blue) and collagen fiber (red) architecture derived from histology and incorporated in the LVFW slab model. Visualizations presented correspond to a 2-wk post-MI specimen.
