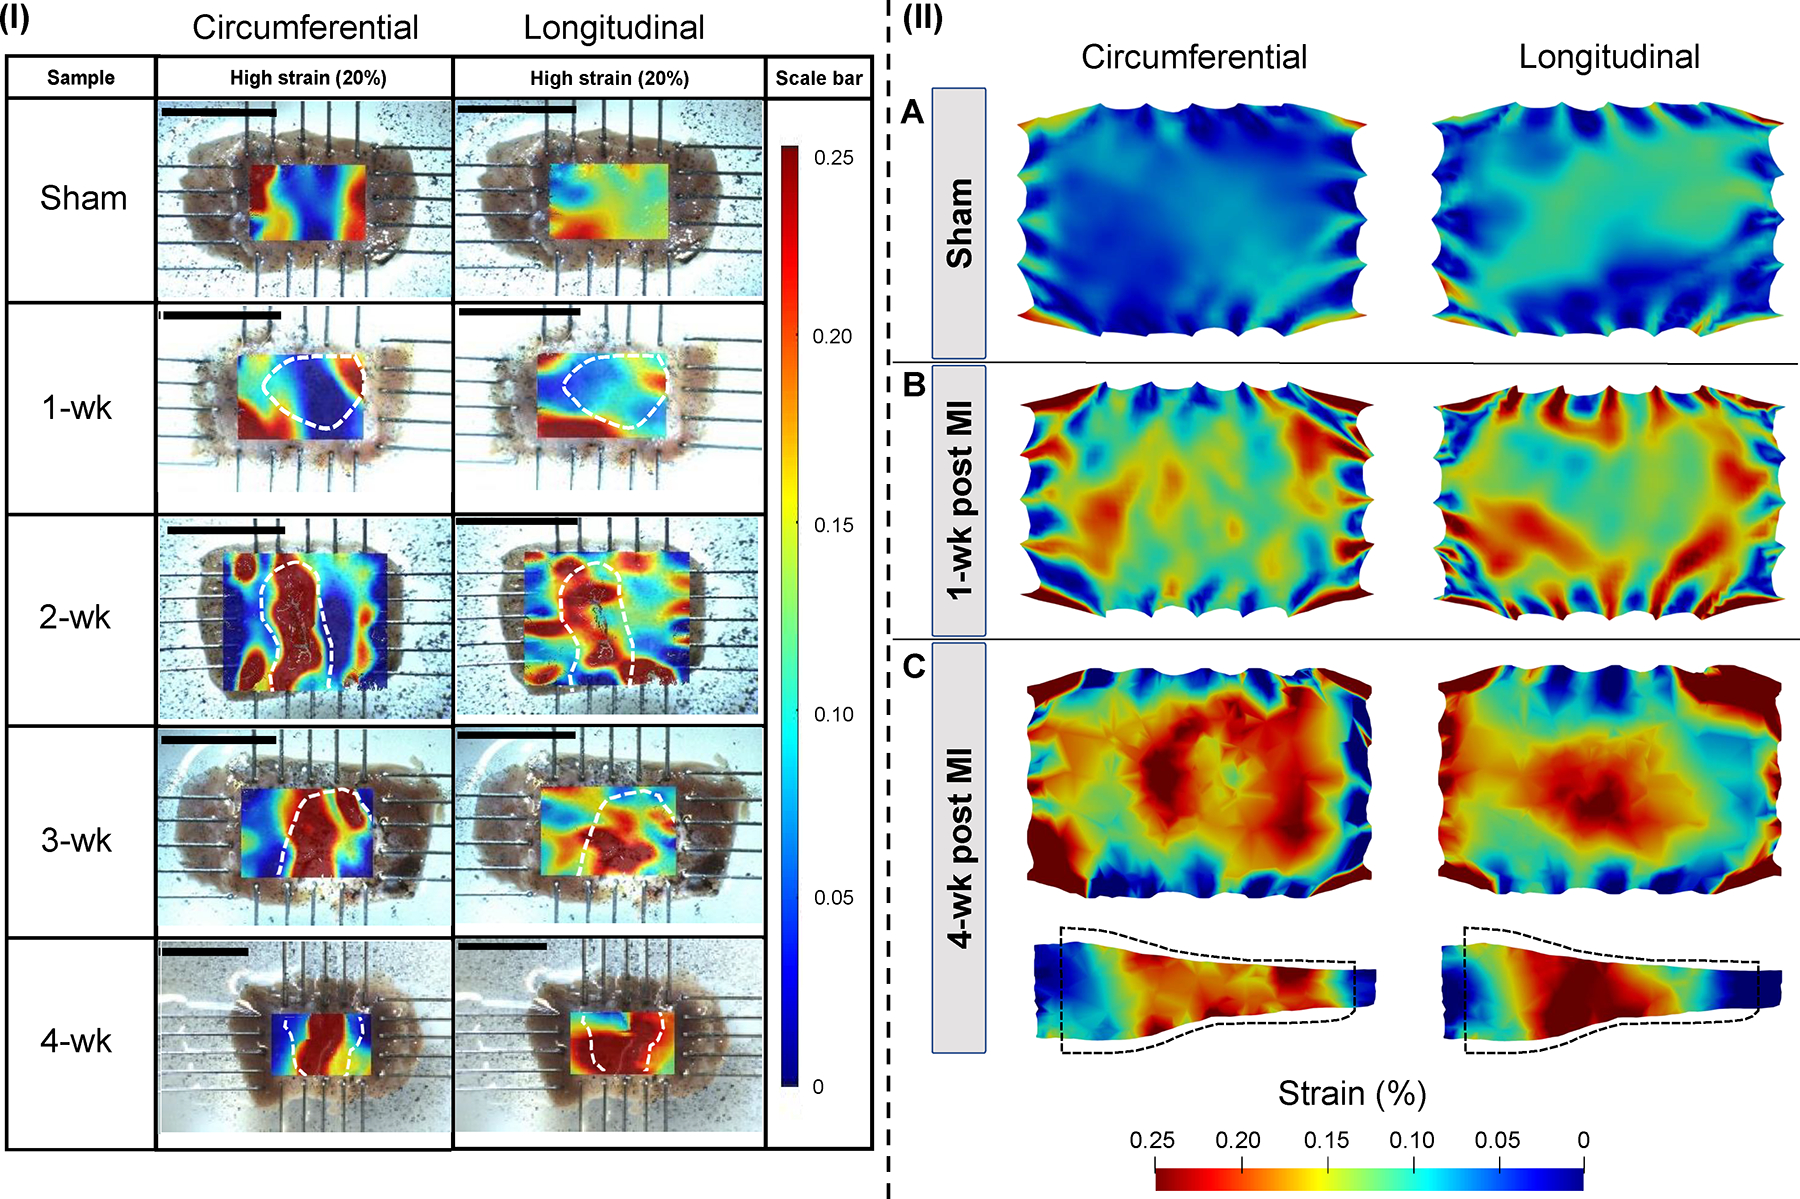
Fig. 6.

(I) Circumferential and longitudinal strain measurements calculated by digital image correlation (DIC). Strains are reported at 20% equibiaxial strain. Infarct scar regions identified through histology are marked in white dashed lines. Scale bars indicate 10 mm. (II) Simulated circumferential and longitudinal strain distributions visualized at the (A) sham, (B) 1-wk, and (C) 4-wk time-points for models with subject-specific regional thickness. Regional strains are reported at 20% loading strain and visualized at a central 2-D cross-section. Side-view 2-D cross-sections are also presented for 1-wk and 4-wk results; the black dashed line indicated the undeformed state.
