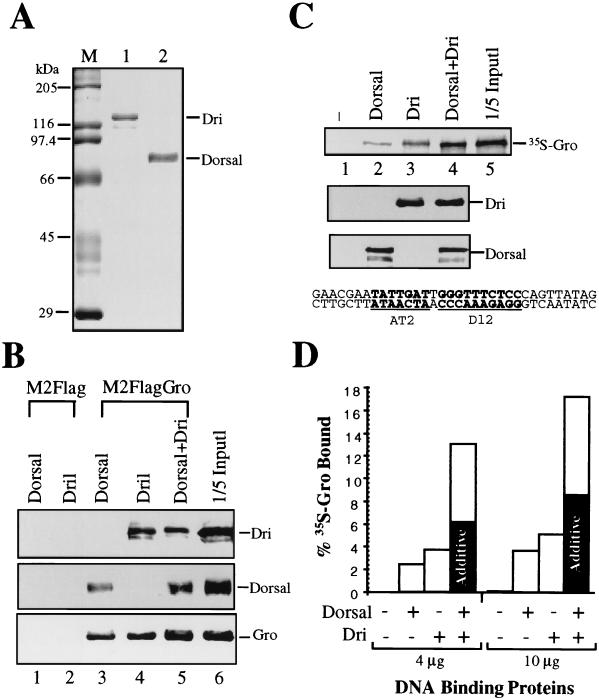
FIG. 6.
Dri and Dorsal physically interact with Gro and cooperatively recruit Gro to DNA. (A) A Coomassie blue-stained gel showing the recombinant Dri (lane 1) and Dorsal (lane 2) used in the experiments presented in panels B and C. M, molecular size markers. (B) Coimmunoprecipitation of baculovirus-expressed Dorsal and Dri with FLAG-tagged Gro using monoclonal M2 antibodies against the FLAG epitope. M2-FLAG attached to agarose was unable to bind Dorsal (lane 1) or Dri (lane 2). When Gro was coupled to the M2-agarose resin via the FLAG epitope, both Dorsal and Dri were retained on the resin (lanes 3 to 5). Lane 6 contains 1/15 of the input protein used in the coimmunoprecipitation experiments shown in the other lanes. Dorsal, Dri, and epitope-tagged Gro were detected by immunoblotting with anti-Dorsal polyclonal, anti-Dri polyclonal, and M2 monoclonal antibodies, respectively. (C) Dorsal and Dri cooperatively recruit Gro to DNA. A DNA fragment containing Dorsal (dl2) and Dri (AT2) binding sites was coupled to agarose resin. The sequence of the DNA fragment was derived from the zen VRR and is shown at the bottom. No Dorsal or Dri (lane 1), 4 μg of Dorsal (lane 2), 4 μg of Dri (lane 3), or 4 μg of both Dorsal and Dri (lane 4) was added to the resin, followed by 35S-labeled Gro. This amount of Dorsal and Dri represents an approximately twofold molar excess over the concentration of sites on the column, and as a result, about 50% of the input Dorsal and Dri was retained on the column. The addition of more Dorsal and Dri did not significantly increase the amount of protein retained on the column (Fig. 6D and data not shown), confirming that the column is saturated. After extensive washing, bound proteins were eluted from the resin with SDS-PAGE sample buffer and fractionated by SDS-PAGE. One-fifth of the input protein used for lanes 1 to 4 is shown in lane 5. (Upper panel) Autoradiogram showing 35S-labeled Gro. (Middle panel) Anti-Dorsal immunoblot. (Lower panel) Anti-Dri immunoblot. (D) Quantification of the Gro recruitment assay. The left half of the bar graph shows the quantification of the experiment shown in panel C. The right half of the bar graph shows the quantification of a similar experiment with 10 μg rather than 4 μg of Dorsal and Dri. The shaded portions of the two bars showing the amount of Gro retained in the presence of both Dorsal and Dri indicate the amount of Gro that would have been retained if the manner in which Dorsal and Dri were functioning were merely additive.

