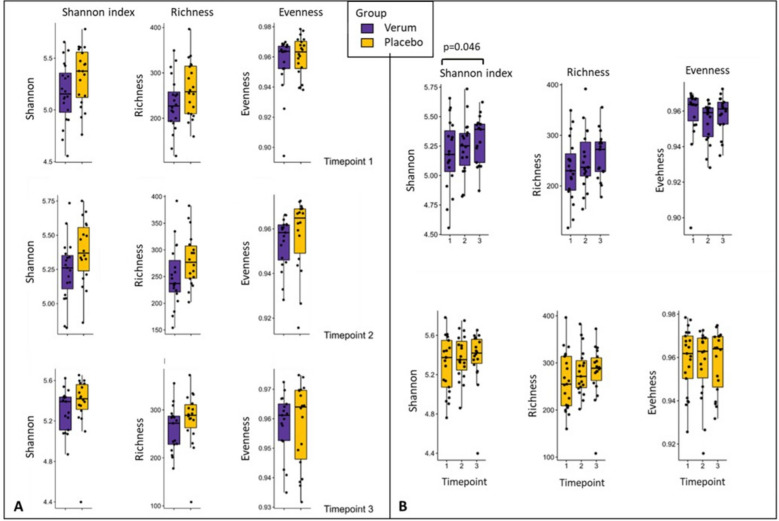
Fig. 2.
Differences in alpha diversity between the verum (V) and the placebo (P) group. The data is based on 16S rRNA gene amplicon sequencing and results are shown for the whole study population of n = 40. A Diversity indicators of V and P did not differ significantly between V and P at the three time points (1: at baseline, 2: after the intervention, 3: after the wash-out period). B Progression of diversity within the groups. In V, Shannon index increased continuously (significant difference as indicated by given p-value from time point 1 to time point 3, based on t-test, paired samples), while it remained constant in P

