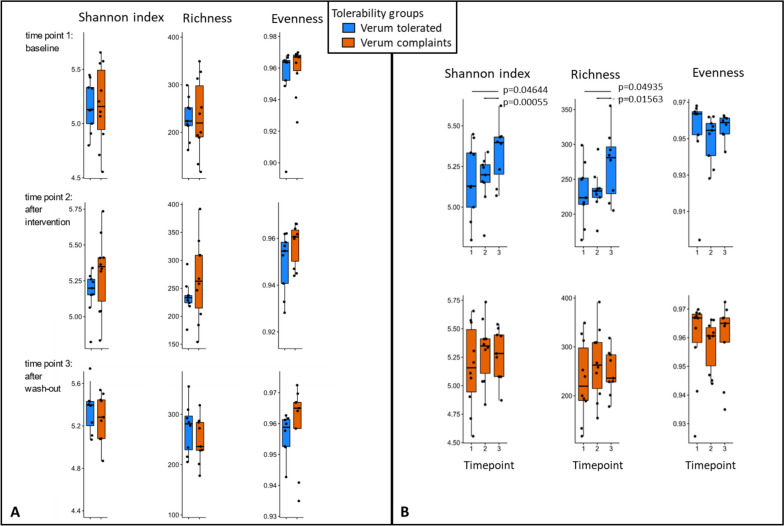
Fig. 3.
Differences in alpha diversity between the verum tolerated (Vt) and the verum complaints (Vc) group. The data is based on 16S rRNA gene amplicon sequencing and results are shown for the verum group of n = 20. A Diversity indicators did not differ significantly between Vt and Vc at the three time points (1: at baseline, 2: after the intervention, 3: after the wash-out period). B In Vt, the Shannon index and richness increased significantly over the study period (normal distribution, t-test for paired samples), while no significant differences were observed for Vc

