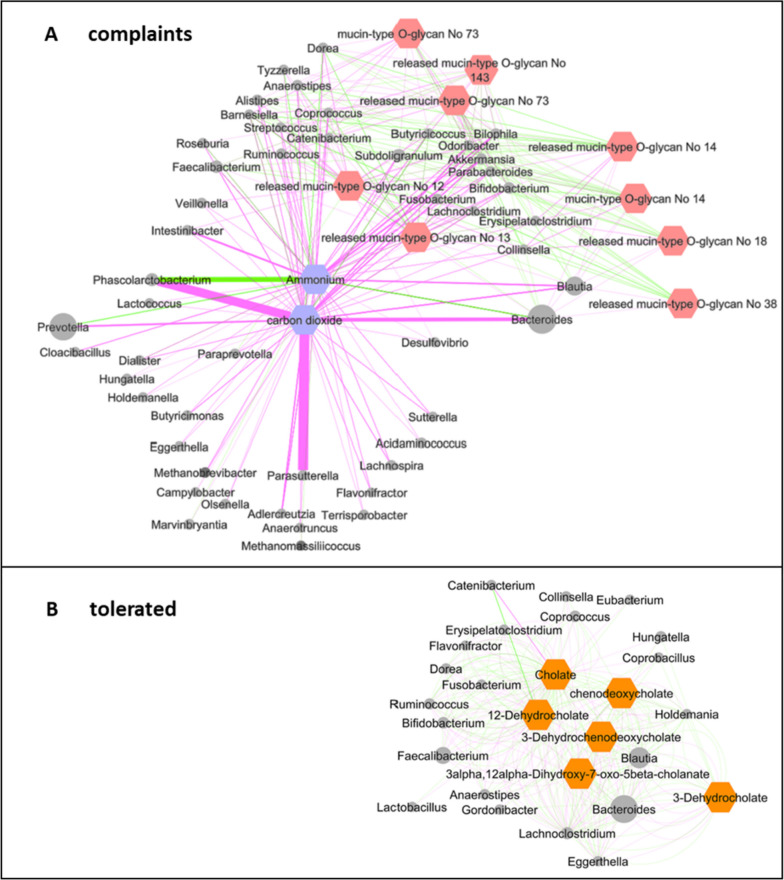
Fig. 6.
Networks of taxa and selected metabolites for verum complaints and verum tolerated at time point 2. The metabolites have been chosen in accordance with Fig. 5. A In Vc (complaints), ammonium and carbon dioxide are highlighted in violet, and O-glycans are highlighted in rose. B In Vt (tolerated), the predicted bile acids are highlighted in orange. In both networks, node size (metabolites and taxa) was scaled according to abundance; bacteria are highlighted in light grey and archaea (methanogens) in dark grey; edges were weighted according to their modeled flux, imported metabolites are connected by green lines, and exported metabolites are connected by pink lines. Network layout is based on an edge-weighted spring-embedded algorithm based on metabolic flux

