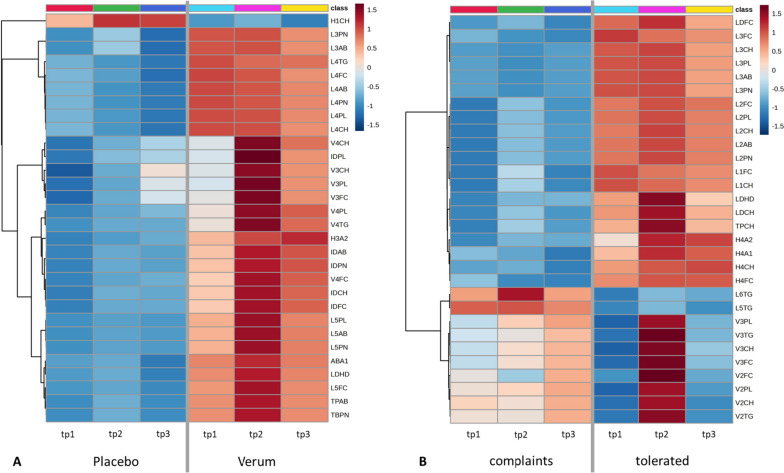
Fig. 7.
Changes in plasma lipoprotein profile over the study period. The 30 most abundant plasma lipoproteins are shown. A The change in plasma lipoprotein profile between the placebo and the verum group is depicted. In the placebo group plasma, lipoproteins were lower compared to the verum group. In the verum group, several plasma lipoproteins increased during the intervention with aronia juice (tp 2), whereas the strongest effects were observed for VLDL, IDL, and LDL sub-fractions. After the intervention (tp2), more than 30 lipoproteins were significantly higher in V compared to P. After the washout phase (tp 3), most of these altered lipoprotein plasma concentrations returned to initial concentrations except for ABA1, IDAB, IDCH, IDFC, and IDPN that remained significantly higher compared to baseline concentrations (tp 1). B The change in plasma lipoprotein profile in the tolerability groups during the intervention is depicted. A significant increase in plasma LDL-lipoproteins was only observed in the group that tolerated the aronia juice. The concentration of most lipoproteins returned to initial levels after the wash out phase. P, placebo; Tp1, time point 1 (baseline); Tp2, time point 2 (after the intervention); Tp3, time point 3 (after the washout phase); V, verum

