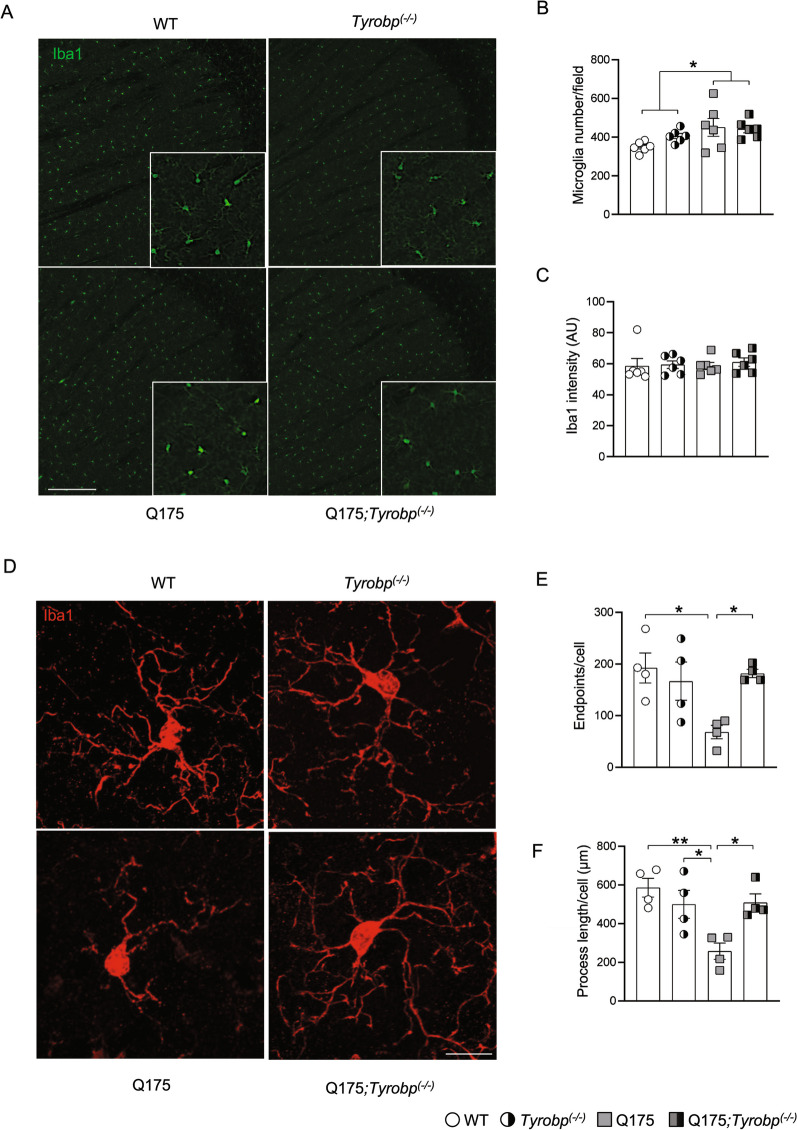
Fig. 2.
Tyrobp deletion corrects microglia morphologic parameters. A Representative Iba1 immunofluorescence (20X) in the striatum of a 10-month old WT or Q175 mouse with (left) and without (right) Tyrobp. Scale bar: 300 µm. Quantification of Iba1-immunopositive B cell number and C intensity in striatal area (n = 6 mice per group with an average of 3 slices per mouse). D High magnification illustration of Iba-1 immunostaining images of the striatum from 10-month old WT and Q175 mice with (left) and without (right) Tyrobp. Scale bar: 15 µm. E Endpoints/cell and F process length of striatal microglia. n = 15 microglia per mouse with n = 4 mice per group. Error bars represent means ± SEM. Males and females were used for experiments, and results were combined for analysis. Statistical analyses were performed using a Two-Way ANOVA with Bonferroni as post-hoc test. *p < 0.05; **p < 0.01

