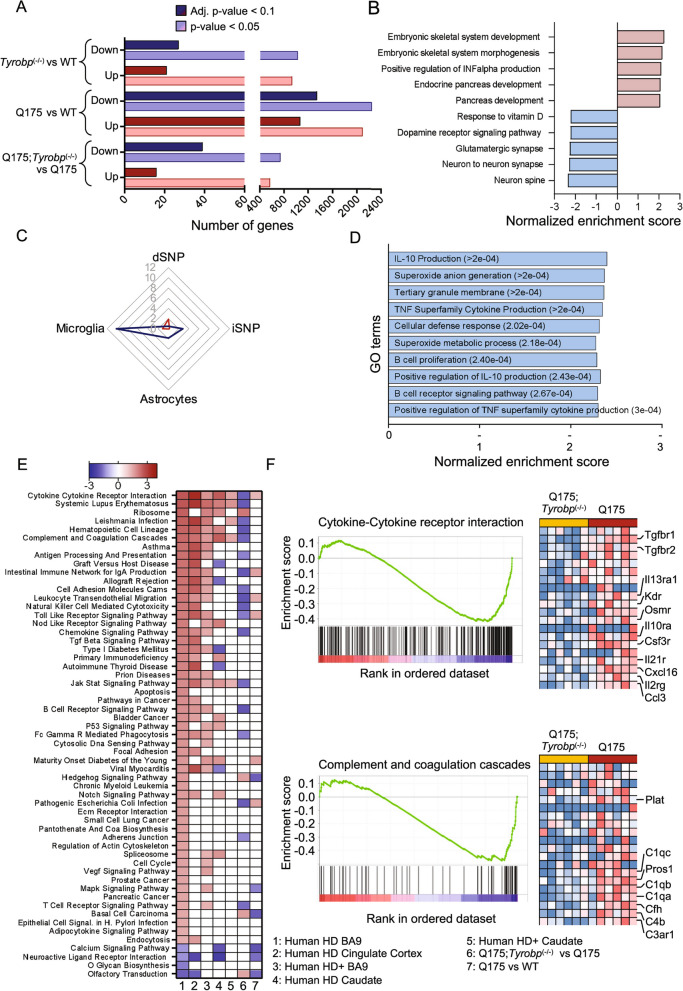
Fig. 5.
Tyrobp deletion reduces pathways activated in human HD brain but not in HD mouse models. Bulk RNA-seq was performed on whole striatal RNA. A The number of DEGs for each data set at adjusted p < 0.1 and nominal p < 0.05 is shown. Blue bars indicate downregulated DEGs, and red bars indicate upregulated DEGs. B GO terms (biological process) associated with genes from Q175 vs WT data sets after GSEA analysis. C Cell-type enrichment analysis for Q175; Tyrobp(−/−) vs Q175 DEGs (nominal p-value < 0.05). Lines represent − log10 p-value of chi-square calculation of the cell type enrichment. D GO terms (biological process) associated to genes from Q175;Tyrobp(−/−) vs Q175 data sets after GSEA analysis. dSNP = direct (Drd1) spiny neurons; iSNP = indirect (Drd2) spiny neurons (E) Heatmap of Normalized Enrichment Score for Kyoto Encyclopedia of Genes and Genomes (KEGG) pathways detected in human and mouse datasets. Pathways have been ranked based on descending normalized enrichment score from the Human HD BA9 dataset (Agus et al., 2019 [15]). Column #1: Human HD Brodmann area 9 (BA9) (Agus et al., 2019 [15]); #2: Human HD Cingulate Cortex (Al-dalahmah et al., 2020 [33]); #3 Presymptomatic human HD BA9 vs control (Agus et al., 2019 [15]); #4: Human HD caudate (CAU) v Control (Elorza et al., 2021 [31]); #5 Presymptomatic Human Caudate (Agus et al., 2019 [15]); #6: Q175;Tyrobp(−/−) vs Q175; #7: Q175 vs WT. F GSEA results for Cytokine-Cytokine receptor interactions and Complement and coagulation cascade pathways. Normalized gene scores are shown

