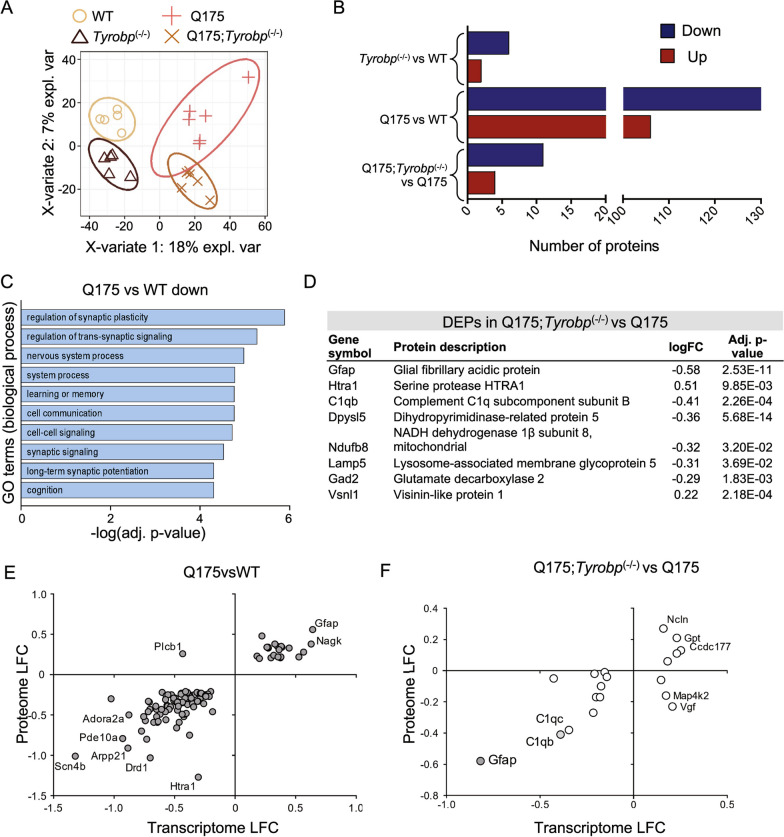
Fig. 6.
Proteomic analysis reveals reduction of astrogliosis in Q175 mice lacking Tyrobp. A Supervised Clustering using Partial Least Squares-Discriminant Analysis (PLS-DA). B Summary of the number of differentially expressed proteins (FDR < 0.05 and absolute log2(fold change) > 0.2). Blue and red bars indicate downregulated and upregulated DEGs, respectively. C GO terms (biological process) associated with downregulated proteins from Q175 vs WT data sets after ConsensusPathDB overrepresentation analysis. D Top differentially expressed proteins in the striatum of Q175;Tyrobp(−/−) vs. Q175 mice. E, F Plot showing Q175 vs WT (left) and Q175;Tyrobp(−/−) vs Q175 (right) log2 fold-change (LFC) in the transcriptome and proteome. The plot only includes those genes detected as both transcripts and proteins and also differentially expressed (adj. p-value < 0.1 for Q175 vs WT comparison; and nominal p-value < 0.05 for Q175;Tyrobp(−/−) vs Q175 comparison). Gray color denotes that the gene was differentially expressed in the transcriptome and proteome with an adj. p-value < 0.1

