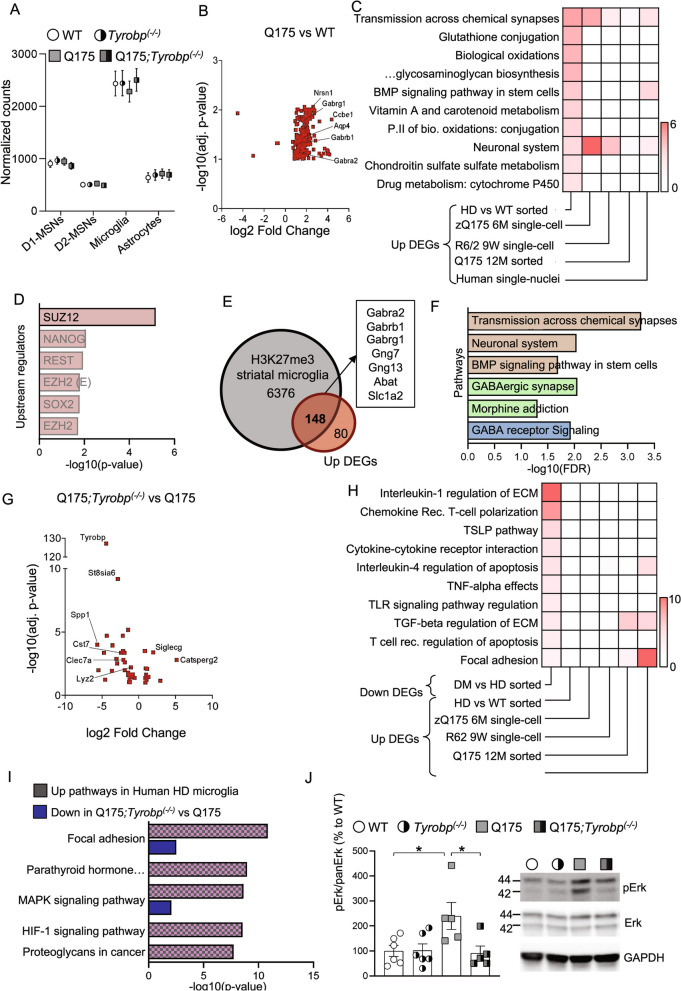
Fig. 8.
Analysis of the HD microglia-specific transcriptome and the consequences of Tyrobp deletion. RNA was purified from freshly isolated striatal microglia and then sequenced. A Analysis of global levels of cell type-specific transcripts from sorted mouse microglia RNA-seq samples using geometric mean of the normalized counts of cell type marker genes of Drd1 (direct)-MSNs, Drd2 (indirect) -MSNs, astrocytes and microglia. B Volcano plot illustrating the DEGs identified in Q175 vs WT comparison. Only the genes with FDR < 0.1 are shown. C Heatmap of binomial p-values for Bioplanet pathways upregulated in human and mouse datasets. D Predicted upstream regulators of upregulated genes from Q175 microglia. E Intersection between genes with H3K27me3 marks from striatal microglia and upregulated genes from Q175 microglia. F Pathways associated with upregulated DEGs with a H3K27me3 mark. Color denotes database (Brown: Bioplanet; Green: KEGG pathways; Blue: Wikpathways). G Volcano plot illustrating the DEGs identified in Q175;Tyrobp(−/−) vs Q175 comparison. Only the genes with FDR < 0.1 are shown. H Heatmap of binomial p-values for Bioplanet pathways decreased in Q175;Tyrobp(−/−), and integration with increased pathways from specified human and mouse datasets. I KEGG pathways enriched for upregulated genes in the microglial cluster of HD human snRNA-seq (pink/gray), integrated with the pathways downregulated by Tyrobp deletion in Q175 mice (blue). J Western blot and densitometric analysis of phosphorylated and total Erk protein in striatal samples. n = 5–6 mice per group. Quantitative analysis is shown as mean ± SEM. Each point represents data from an individual mouse. Statistical analysis was performed using Two-Way ANOVA. *p < 0.05

