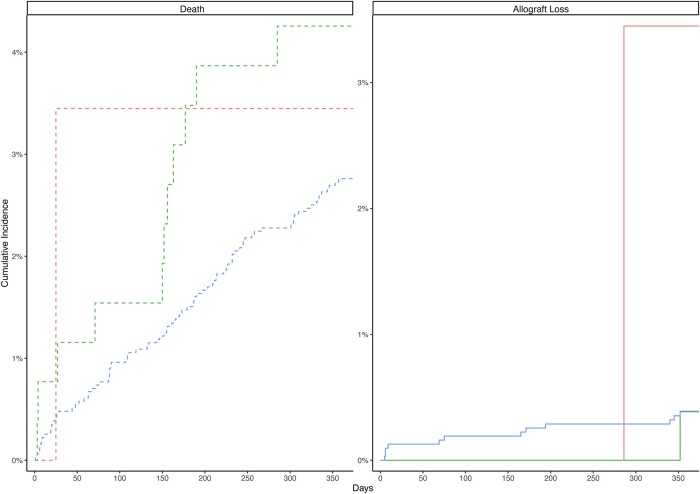
Figure 3.
Cumulative incidence curves for 1-year mortality and 1-year allograft loss of renal transplant recipients by early post-transplant positive culture status, 2005–2021 (n = 3432). Cumulative incidence curves for 1-year mortality (left panel, dashed line) and 1-year allograft loss (right panel, solid line) comparing renal transplant recipients with a multidrug-resistant organism detected on early post-transplant culture (red), a comparative antibiotic-susceptible organism detected on post-transplant culture (green), and negative controls (blue). Time is measured from transplant until event.

