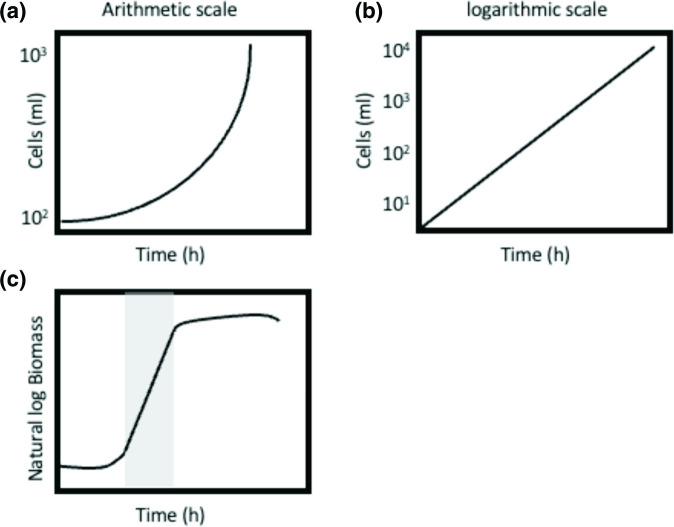
Fig. 1.
Plots illustrating the growth of microbial populations. (a) Plotting cell numbers against time on an arithmetic scale gives rise to a curve when growth is exponential. (b) When the same data are plotted on a semi-logarithmic scale the relationship is linear, and the slope of the line is equal to the specific growth rate, µ. (c). When considering the increase in biomass, rather than cell numbers, the natural logarithm of biomass plotted against time results in a straight line during the exponential phase of growth (grey), and again the slope of the line is equal to the specific growth rate, µ (h−1).

