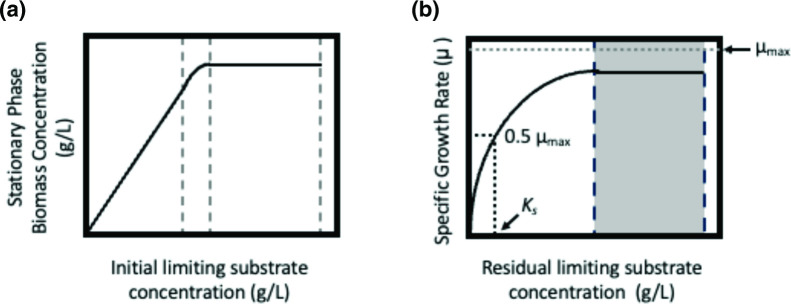
Fig. 2.
Plots illustrating the relationship between growth of microbial cultures and growth-limiting substrates. (a) The effect on biomass at stationary phase as a function of initial substrate concentration. (b) The effect of residual growth-limiting substrate on specific growth rate, µ. The region in grey is equivalent to the exponential phase of growth, essentially µ max. The estimation of K s is indicated with the dotted line, where s=K s, µ=0.5µ max.

