

Abstract
Underlying mechanisms of the inverse relationship between moderate alcohol consumption and cardiometabolic disorders are unclear. Modification by types of alcoholic beverages consumed and drinking pattern remains understudied. We aimed to provide insight into the mechanisms by examining 14 insulinemic/glycemic, inflammatory and lipid markers. We used cross-sectional data from 15,436 women in the Nurses’ Health Study, 19,318 women in the Nurses’ Health Study II, and 6872 men in the Health Professionals Follow-up Study. Multivariable linear regression was used to estimate the percentage differences in biomarker concentrations according to alcohol intakes. The average alcohol intake in the combined cohort was 3.3 servings/week. We found a 1 serving/d increment in alcohol intake (14g ethanol, 44 ml liquor or 355 ml beer or 118 ml wine per day) was associated with a 0.6% lower level of HbA1c, 1.7% to 3.6% lower proinflammatory markers and 4.2% higher adiponectin, as well as 7.1% higher HDL-cholesterol and 2.1% lower triglyceride with a significant linear trend. Wine, especially red wine, was associated with lower inflammation in particular. Beer had weaker favorable to null associations with blood lipids and adiponectin. Liquor was associated with higher C-peptide and interleukin-6, yet equally associated with lower HbA1c and higher HDL-cholesterol as other beverages. Drinking 3 days or more per week was related to a better biomarker profile than nonregular drinking independent of intake levels. Drinking appeared to have similar associations irrespective whether done with meals or not. Our data indicated moderate alcohol intake, especially if consumed from wine and done regularly, was associated with favorable profiles of insulinemic/glycemic and inflammatory markers and blood lipids.
Keywords: alcohol, wine, beer, liquor, drinking pattern, glycemic control, inflammation, lipids
Introduction
Excessive alcohol drinking causes many adverse outcomes and increases total mortality, while moderate drinking (1 serving/d or less for women and 2 servings/d or less for men [1]) is often associated with a lower risk of cardiovascular diseases (CVD) and type 2 diabetes [2]. Inverse associations from previous observational studies have been viewed cautiously due to concern about potential confounding by lifestyle and socioeconomic status (SES), and “sick quitters” effects resulting from the inclusion of former heavy drinkers who quit due to sickness as nondrinkers. Underlying mechanisms of the inverse relationship between moderate drinking and cardiometabolic diseases are unclear. Randomized controlled trials (RCTs) studying short-term alcohol consumption and biomarkers have provided some clues, although evidence is more consistent regarding alcohol improving HDL-cholesterol and glycemic control yet less consistent for how alcohol influences inflammatory markers [3, 4]. Besides RCTs’ limited ability to establish dose-response relationships, other important questions remain such as modification by types of alcoholic beverages consumed and pattern of drinking. Some studies have suggested the benefit of wine or beer consumption over liquor [5, 6] and of distributing consumption to more days with meals over binge drinking during weekends on an empty stomach [7], but the totality of evidence does not provide a clear conclusion [3, 8] and the comparison between red and white wine was understudied.
Utilizing data from three large prospective cohorts of US adults, the Nurses’ Health Study (NHS), Nurses’ Health Study II (NHSII) and Health Professionals Follow-up Study (HPFS), a few earlier analyses have been done for several inflammatory markers and in diabetic patients with small sample sizes (≤1500) [9, 10]. In the present study, we expanded associations with moderate alcohol intake to a more comprehensive set of biomarkers related to insulin resistance/glycemic control and inflammation as well as blood lipids in apparently healthy individuals with a much larger sample size (41,626). We also examined the associations separately by types of beverages and various aspects of drinking pattern (frequency, binge, with meals).
Method
Study population
The NHS began in 1976 and enrolled 121,700 female registered nurses aged 30–55 y at baseline. The NHSII began in 1989 and enrolled 116,429 younger female nurses aged 25–42 y [11]. The HPFS began in 1986 and enrolled 51,529 male health professionals aged 40–75 y [12]. In each cohort, mailed questionnaires were conducted biennially to collect information on lifestyle and medical factors, with a follow-up rate exceeding 90% for each 2-y cycle. Blood samples were provided by 32,826 women in NHS between 1989 and 1990, by 29,611 women in NHSII between 1996 and 1999, and by 18,159 men in HPFS between 1993 and 1995. Participants who provided blood samples were generally similar with those who did not regarding demographics and lifestyle characteristics [13]. For the current study, we included participants who provided a blood sample and had their biomarkers measured when involved in prior nested case-control studies. We excluded participants who had a history of diabetes (n=1795), CVD (n=1315) or cancer (n=1489) at blood draw. We further excluded those with missing data on alcohol intake (n=1060). These criteria led to a final study population of 41,626 individuals (15,436 from NHS, 19,318 from NHSII and 6872 from HPFS). The study protocol was approved by institutional review boards of the Brigham and Women’s Hospital and Harvard T.H. Chan School of Public Health. All participants provided written consent.
Assessment of alcohol intake and drinking pattern
Alcohol intake was assessed via validated food-frequency questionnaires (FFQs) administered every 4 years [14]. In each FFQ, participants were asked the average frequency over the previous year of consuming one standard serving/drink of each alcoholic beverage (1.5 oz/44 ml for liquor, 12 oz/355 ml for beer and 4 oz/118 ml for white wine and red wine), with the options ranging from “never or less than once per month” to “6 or more times per day”. Total wine was computed as the sum of white wine and red wine. Total alcohol was computed as the sum of liquor, beer and total wine. The type of drinkers was defined based on the beverage they consumed with the highest frequency. In main analyses, we used the average intake from the last 2 FFQs administered before blood collection (1986 and 1990 for NHS, 1995 and 1999 for NHSII, and 1990 and 1994 for HPFS). We also considered the change in alcohol intake between these 2 FFQs in secondary analyses. On average, the midpoint of these 2FFQs preceded blood collection by 18, 6 and 22 months in NHS, NHSII and HPFS, respectively.
Data on drinking pattern were collected in 1988 among NHS and HPFS participants and in 1989 among NHSII participants, where they were asked the usual number of days of alcohol consumption in a week, and the maximum number of drinks per drinking occasion (with the options ranging from “0” to “≥15”). In line with previous literature [15], we defined regular drinking as 3 or more days of consumption in a week and defined binge drinking as 4 or more drinks on an occasion for women or 5 or more drinks on an occasion for men. In 1994, participants in HPFS were additionally asked the proportion of alcohol consumed with meals, with options ranging from “<25%”, to “>75%”.
Participants were also asked how their alcohol intake had changed in the past 10 years, with the options “greatly increased”, “greatly decreased” and “no change” in 1980 NHS and 1986 HPFS questionnaires. In NHSII, alcohol consumption at ages 15–17, 18–22, 23–30 and 31–40 was instead collected in the 1989 questionnaire. We considered current nondrinkers who reported to have greatly decreased alcohol consumption (in NHS and HPFS) or whose consumption exceeded 1 serving/d at any younger ages (in NHSII) as former drinkers.
The FFQ-measured alcohol intakes have been validated against multiple one-week diet records in these cohorts [16]. Correlation coefficients for liquor, beer and wine intake were 0.80, 0.81 and 0.83 respectively in women, and 0.86, 0.76 and 0.70 in men.
Biomarker assessment
Procedures for blood collection, handling and storage have been described elsewhere [17]. In the current study, we focused on 14 insulinemic/glycemic, inflammatory markers and blood lipids that have been shown to be related to the etiology of type 2 diabetes or CVD and were available in our cohorts: C-peptide, HbA1c, C-reactive protein (CRP), interleukin-6 (IL-6), tumor necrosis factor receptor 1 (TNF-R1), tumor necrosis factor receptor 2 (TNF-R2), intracellular adhesion molecule 1 (ICAM-1), adiponectin, leptin, total cholesterol (TC), HDL-cholesterol (HDL-C), LDL-cholesterol (LDL-C), triglyceride (TG) and TG/HDL-C ratio. All biomarkers were measured using standard methods [17]. Quality-control samples were randomly interspersed among participants’ samples. Intra-assay coefficients of variation were lower than 20% for each biomarker. Considering biomarkers were measured in multiple batches and there might be laboratory drift over time, all biomarker concentrations were recalibrated to an “average batch” within each cohort using the method described by Rosner et al. [18].
Covariate assessment
Overall diet quality was represented by the Alternative Healthy Eating Index (AHEI)-2010 [19] (excluding the alcohol component) and calculated with average intake from the 2 FFQs closest to blood draw. A higher score indicates better diet quality. Based on updated information in biennial questionnaires, physical activity was calculated by multiplying weekly hours spent on various forms of exercise and the metabolic equivalent of task (MET) score of each activity and then summing up to obtain a total weekly MET-hours. We used the cumulative average physical activity and BMI (from 1986 to 1990 questionnaires for NHS, 1995 to 1999 questionnaires for NHSII, and 1990 to 1994 questionnaires for HPFS) in main analyses to reduce measurement error. For other covariates, we used the questionnaire closest to the blood draw. The correlation coefficient between questionnaire-based and diary-based activity scores was 0.58 and that between self-reported and technician-measured weights was 0.97 [20, 21].
Neighborhood SES for participants was assessed based on the census block of their addresses reported in biennial questionnaires and linked to 1990 and 2000 census data. Wealth (median household income, median value of housing units, % of households receiving interest or rent), education (% of adults with a high school degree and % with a college degree) and occupation (% employed) of the census block were standardized and then combined into this neighborhood socioeconomic score, with higher scores suggesting higher levels of neighborhood SES [22].
Statistical analyses
We constructed multivariable generalized linear models to evaluate associations between alcohol intake and biomarker concentrations. All biomarkers were natural log-transformed to improve normality, and thus results were presented as percentage differences calculated using the equation: [exp (β-coefficient) −1] × 100%. Alcohol intake was categorized as nondrinkers, >0 to 1, >1 to 2 and >2 servings/d for evaluation of the dose-response relationship. Median values of intake were assigned to each category to create a continuous variable and Wald test of the quadratic term of this variable was conducted to assess linearity.
Because the participants in the three cohorts were similar in race/ethnicity, lifestyle, occupation and SES, and the characteristics’ patterns according to alcohol intakes were similar, data from all three cohorts were combined for main analyses. Model 1 was adjusted for age at blood draw, sex, case-control and fasting status and total energy intake. Model 2 was additionally adjusted for physical activity, smoking, AHEI-2010 excluding alcohol, multivitamin use, regular use of aspirin or nonsteroidal anti-inflammatory drugs (NSAIDs), history of hypertension and hypercholesterolemia, use of cholesterol-lowering drugs, BMI, waist circumference, and menopausal status and menopausal hormone therapy (women only). In secondary analyses of 4-y changes in alcohol intake with biomarker, average total energy intake, physical activity, AHEI-2010 score and BMI were replaced with their baseline values and 4-y changes, and baseline alcohol intake was included in the model.
In sensitivity analyses, we restricted the analysis to participants who provided fasting blood, who were selected as controls in previous case-control studies and who reported no history of hypertension or hypercholesterolemia, and excluded former drinkers or all nondrinkers to test the robustness of results. We also checked the results after additionally adjusting for neighborhood SES.
We also examined associations between alcohol intake and biomarker concentrations stratified by cohort, sex, age at blood draw (<60/≥60 years), smoking (never/ever), physical activity (below/above median) and BMI (<25.0/25.0–29.9/≥30.0 kg/m2). Effect modification was assessed by likelihood ratio tests comparing the model with and without the product term between 1 serving/d of alcohol intake and each of the stratified variables above.
To explore potential heterogeneous associations of each alcoholic beverage with biomarkers, separate analyses for consuming 1 serving/d of liquor, beer, total wine, white wine and red wine were conducted. The multivariable models were adjusted for the same set of covariates as in Model 2 and were mutually adjusted for each other to account for consumption of multiple alcoholic beverages. We also estimated percentage differences in biomarkers of substituting 1 serving/d of each beverage with the same quantity of other alcoholic beverages using the partition model approach [23].
Finally, we examined associations between biomarkers and drinking pattern which was jointly defined by regular drinking and binge drinking, taking nondrinkers as the reference group. Associations with drinking with meals were examined in HPFS, taking <25% as the reference.We considered two-sided P<0.005 to be statistically significant and 0.005≤P<0.05 to be suggestively significant. SAS version 9.4 (SAS institute) was used for all statistical analyses.
Data and Resource Availability
Data described in the article, code book, and analytic code will be made available upon request pending approval by the Channing Division of Network Medicine at Brigham and Women’s Hospital and Harvard Medical School. Further information including the procedures to obtain and access data from the Nurses’ Health Study and the Health Professionals Follow-Up Study is described at https://www.nurseshealthstudy.org/researchers (contact e-mail: nhsaccess@channing.harvard.edu) and https://sites.sph.harvard.edu/hpfs/for-collaborators/.
Results
A total of 34,754 women and 6872 men were included in our study. 71% of our population drank alcohol. The average alcohol intake was 3.3 servings/week (4.8 servings/week in drinkers) (Supplementary Figure 1). HPFS had the highest intake of 6.6 servings/week mainly contributed by liquor and beer drinking while NHSII had the lowest intake of 2.3 servings/week mainly contributed by white wine and beer. Within each sex, compared with nondrinkers and those who drank less than 1 serving/d, participants who drank more tended to be older, current smokers with greater pack-years, regular aspirin and NSAIDs users and have higher energy intake, physical activity, SES and lower BMI (Table 1). Biomarker concentrations according to alcohol intake categories are presented in Supplementary Table 1.
Table 1.
Characteristics of participants at blood draw according to total alcohol intake in the combined cohorta
| Women (n=34,754) | Men (n=6872) | |||||||
|---|---|---|---|---|---|---|---|---|
| Non drinkers | >0 to 1 serving/d | >1 to 2 servings/d | >2 servings/d | Non drinkers | >0 to 1 serving/d | >1 to 2 servings/d | >2 servings/d | |
| n=10,820 | n=19,960 | n=2674 | n=1300 | n=1248 | n=3290 | n=1317 | n=1017 | |
| Age at blood draw, y | 49.6 ± 8.9 | 49.7 ± 8.6 | 51.7 ± 8.8 | 53.5 ± 8.6 | 62.0 ± 8.6 | 62.0 ± 8.6 | 62.4 ± 8.1 | 62.5 ± 8.2 |
| Total alcohol, grams/d | 0 ± 0 | 3.8 ± 3.3 | 16.8 ± 3.7 | 35.8 ± 10.8 | 0 ± 0 | 5.3 ± 3.7 | 18.1 ± 3.9 | 40.1 ± 13.5 |
| Total alcohol, servings/d | 0 ± 0 | 0.3 ± 0.3 | 1.4 ± 0.3 | 2.9 ± 0.9 | 0 ± 0 | 0.4 ± 0.3 | 1.4 ± 0.3 | 3.2 ± 1.0 |
| Liquor, servings/week | 0 ± 0 | 0.5 ± 1.0 | 2.5 ± 3.2 | 6.0 ± 7.5 | 0 ± 0 | 0.8 ± 1.3 | 3.6 ± 3.3 | 9.5 ± 8.4 |
| Beer, servings/week | 0 ± 0 | 0.5 ± 1.0 | 2.1 ± 2.8 | 5.0 ± 7.7 | 0 ± 0 | 0.9 ± 1.2 | 3.1 ± 2.8 | 6.7 ± 7.4 |
| Total wine, servings/week | 0 ± 0 | 1.2 ± 1.4 | 5.1 ± 3.6 | 9.5 ± 8.4 | 0 ± 0 | 1.2 ± 1.4 | 3.3 ± 2.7 | 5.9 ± 6.9 |
| White wine, servings/week | 0 ± 0 | 0.8 ± 1.1 | 3.3 ± 3.2 | 6.5 ± 7.0 | 0 ± 0 | 0.7 ± 0.9 | 1.8 ± 1.9 | 3.2 ± 4.6 |
| Red wine, servings/week | 0 ± 0 | 0.4 ± 0.7 | 1.8 ± 2.4 | 3.1 ± 5.2 | 0 ± 0 | 0.5 ± 0.8 | 1.5 ± 1.7 | 2.7 ± 4.3 |
| Days drinking in a week | / | 2.0 ± 1.5 | 4.3 ± 2.0 | 5.5 ± 1.7 | / | 2.3 ± 1.6 | 4.6 ± 1.8 | 6.0 ± 1.3 |
| Maximum drinks per occasion | / | 2.5 ± 1.7 | 3.6 ± 2.1 | 4.7 ± 2.4 | / | 2.3 ± 1.7 | 3.2 ± 2.1 | 4.9 ± 2.6 |
| Current smokers, % | 7.6 | 10.4 | 14.5 | 22.7 | 4.6 | 5.2 | 5.2 | 12.0 |
| Pack-years among ever-smokers | 5.9 ± 13.5 | 7.8 ± 13.7 | 11.5 ± 15.9 | 17.3 ± 20.2 | 8.6 ± 16.2 | 10.5 ± 16.3 | 13.1 ± 16.7 | 19.3 ± 19.8 |
| AHEI score excluding alcohol | 46.1 ± 10.3 | 47.6 ± 9.6 | 48.3 ± 9.4 | 46.8 ± 8.8 | 48.2 ± 10.6 | 49.2 ± 10.2 | 49.4 ± 9.7 | 47.2 ± 9.1 |
| Total energy intake, kcal/d | 1775 ± 509 | 1803 ± 488 | 1887 ± 484 | 1981 ± 465 | 1959 ± 570 | 1947 ± 539 | 2043 ± 520 | 2191 ± 524 |
| Physical activity, MET-h/week | 13.9 ±15.9 | 16.8 ± 17.5 | 19.2 ± 18.9 | 17.4 ± 17.6 | 28.5 ± 22.3 | 30.8 ± 22.7 | 33.0 ± 22.7 | 31.9 ± 21.7 |
| BMI, kg/m2 | 26.7 ± 5.9 | 25.5 ± 4.9 | 24.1 ± 3.8 | 24.5 ± 3.9 | 25.6 ± 3.4 | 25.6 ± 3.1 | 25.3 ± 2.7 | 25.7 ± 2.7 |
| Waist circumference, cm | 79.8 ± 10.2 | 78.2 ± 9.0 | 76.8 ± 8.1 | 78.1 ± 8.1 | 94.3 ± 8.1 | 94.6 ± 8.2 | 94.0 ± 7.0 | 95.4 ± 7.8 |
| Hypertension, % | 20.0 | 16.4 | 14.5 | 21.0 | 23.1 | 23.5 | 23.6 | 30.0 |
| Hypercholesterolemia, % | 31.2 | 29.4 | 25.1 | 28.4 | 36.5 | 37.3 | 39.0 | 42.1 |
| Cholesterol-lowering drug use, % | 3.6 | 3.0 | 2.7 | 2.9 | 6.0 | 7.2 | 8.3 | 7.9 |
| Regular aspirin or NSAID use,b % | 47.8 | 51.7 | 55.2 | 55.7 | 51.1 | 56.9 | 62.7 | 64.6 |
| Multivitamin use, % | 45.2 | 46.6 | 45.0 | 46.4 | 39.6 | 42.8 | 39.8 | 41.6 |
| Neighborhood socioeconomic score | −0.9 ± 4.6 | 0.4 ± 4.8 | 1.5 ± 5.1 | 1.0 ± 5.2 | −0.7 ± 4.4 | 0.2 ± 4.7 | 0.3 ± 4.7 | 0.0 ± 4.5 |
| Postmenopausal, % | 44.3 | 43.0 | 42.6 | 46.4 | / | / | / | / |
| Current menopausal hormone use,c % | 21.5 | 21.6 | 21.5 | 22.0 | / | / | / | / |
Values are means ± SDs for continuous variables and percentages for categorical variables. All variables were standardized by age at blood draw. MET, metabolic equivalent of task; AHEI, Alternative Healthy Eating Index; NSAID, nonsteroidal anti-inflammatory drug. /, non-applicable.
Regular users were defined as ≥2 tablets of aspirin (325 mg/tablet) or NSAIDs per week.
Defined in menopausal women only.
The dose-response relationships between alcohol intake and biomarkers were mostly monotonic (Supplementary Figure 2). P-values suggested overall absence of evidence for non-linearity or modest non-linearity and justified presenting results for 1 serving/d of intake as in Table 2. In the combined cohort, a 1 serving/d increment in alcohol intake was associated with favorable profiles of several biomarkers: 0.6% lower level of HbA1c, 1.7% to 3.6% lower proinflammatory markers and 4.2% higher adiponectin, as well as 1.4% higher TC (likely driven by 7.1% higher HDL-C) and 2.1% lower TG with a significant linear trend. Most of these associations were also observed for increasing alcohol intake for 1 serving/d during the 4 years prior to blood draw, although their magnitudes were smaller. Considering the possibility that some may had reduced alcohol consumption due to disease occurrence or preclinical phases, for the latter analyses, we further excluded those who developed hypertension during the 4-y period or who became cases in prior case-control studies within 4 years after blood draw; yet results remained essentially unchanged (data not shown).
Table 2.
Percentage of differences (95%CIs) in biomarker concentrations associated with 1 serving/d increase in average alcohol intake and in 4-year change of alcohol intake
| Alcohol intake | Change in alcohol intake | |
|---|---|---|
| Insulinemic/glycemic markers | ||
| C-peptide | ||
| n | 12,450 | 11,035 |
| Model 1 | −1.3 (−2.3, −0.3) * | −0.1 (−1.6, 1.3) |
| Model 2 | −0.7 (−1.6, 0.3) | 0.2 (−1.2, 1.6) |
| HbA1c | ||
| n | 9958 | 8642 |
| Model 1 | −0.7 (−0.8, −0.5) *** | −0.2 (−0.5, 0.0) |
| Model 2 | −0.6 (−0.8, −0.4) *** | −0.2 (−0.4, 0.0) |
| Inflammatory markers | ||
| CRP | ||
| n | 16,403 | 14,350 |
| Model 1 | −3.9 (−5.8, −2.1) *** | −1.8 (−4.6, 1.1) |
| Model 2 | −1.7 (−3.4, 0.1) | −1.0 (−3.6, 1.7) |
| IL-6 | ||
| n | 11,040 | 9678 |
| Model 1 | −2.0 (−3.4, −0.7) ** | −2.0 (−4.0, 0.0) |
| Model 2 | −0.6 (−1.9, 0.7) | −0.9 (−2.9, 1.1) |
| TNF-R1 | ||
| n | 3323 | 2892 |
| Model 1 | −4.2 (−5.2, −3.1) *** | −2.6 (−4.1, −1.0) ** |
| Model 2 | −3.5 (−4.5, −2.4) *** | −1.9 (−3.4, −0.2) * |
| TNF-R2 | ||
| n | 10,739 | 9364 |
| Model 1 | −3.9 (−4.4, −3.3) *** | −1.4 (−2.3, −0.6) *** |
| Model 2 | −3.6 (−4.1, −3.0) *** | −1.2 (−2.0, −0.3) * |
| ICAM-1 | ||
| n | 6276 | 5501 |
| Model 1 | −0.8 (−1.4, −0.1) * | −0.3 (−1.3, 0.6) |
| Model 2 | −1.7 (−2.3, −1.1) *** | −0.8 (−1.7, 0.2) |
| Adiponectin | ||
| n | 13,943 | 12,230 |
| Model 1 | 5.6 (4.6, 6.6) *** | 2.5 (1.1, 3.9) *** |
| Model 2 | 4.2 (3.2, 5.2) *** | 1.8 (0.4, 3.2) * |
| Leptin | ||
| n | 9870 | 8806 |
| Model 1 | −4.6 (−6.2, −2.9) *** | −2.4 (−4.7, 0.0) * |
| Model 2 | −0.9 (−2.3, 0.4) | 0.5 (−1.4, 2.5) |
| Lipid markers | ||
| TC | ||
| n | 15,009 | 13,103 |
| Model 1 | 1.4 (1.0, 1.7) *** | 0.4 (−0.1, 0.9) |
| Model 2 | 1.4 (1.1, 1.8) *** | 0.8 (0.3, 1.3) ** |
| HDL-C | ||
| n | 8655 | 7563 |
| Model 1 | 7.7 (7.0, 8.4) *** | 4.5 (3.5, 5.5) *** |
| Model 2 | 7.1 (6.4, 7.8) *** | 4.4 (3.4, 5.4) *** |
| LDL-C | ||
| n | 7199 | 6339 |
| Model 1 | −0.5 (−1.2, 0.2) | −0.9 (−2.0, 0.1) |
| Model 2 | −0.4 (−1.1, 0.2) | −0.3 (−1.3, 0.7) |
| TG | ||
| n | 10,253 | 8980 |
| Model 1 | −3.5 (−4.7, −2.3) *** | −3.0 (−4.7, −1.2) ** |
| Model 2 | −2.1 (−3.2, −1.0) *** | −1.6 (−3.2, 0.1) |
| TG/HDL-C ratio | ||
| n | 6115 | 5391 |
| Model 1 | −8.3 (−10.0, −6.6) *** | −6.0 (−8.5, −3.3) *** |
| Model 2 | −7.5 (−9.1, −5.9) *** | −5.4 (−7.9, −2.9) *** |
Model 1 was adjusted for age at blood draw (continuous), sex (male/female), case-control status (case/control), fasting status (fasting/not fasting) and total energy intake (quartiles). Model 2 was additionally adjusted for physical activity (quartiles), smoking status and intensity (never smoker/former smoker, pack-years<30/former smoker, pack-years≥30/current smoker, pack-years<30/current smoker, pack-years≥30), AHEI score excluding alcohol (quartiles), multivitamin use (yes/no), regular use of aspirin or nonsteroidal anti-inflammatory drug use (yes/no), hypertension (yes/no), hypercholesterolemia (yes/no), use of cholesterol-lowering drugs (yes/no), BMI (<23.0/23.0–24.9/25.0–27.4/27.5–29.9/≥30.0 kg/m2) and waist circumference (continuous), and for women, menopausal status (premenopausal/postmenopausal/unknown) and menopausal hormone therapy (never/past/current use).
In change analyses, the average total energy intake, physical activity, AHEI-2010 score and BMI were replaced with their baseline values and 4-y changes (all continuous), and the baseline alcohol intake (continuous) was further adjusted.
CRP, C-reactive protein; IL-6, interleukin-6; TNF-R1, tumor necrosis factor receptor 1; TNF-R2, tumor necrosis factor receptor 2; ICAM-1, intracellular adhesion molecule 1; TC, total cholesterol; HDL-C, HDL-cholesterol; LDL-C, LDL-cholesterol; TG, triglyceride. Ref, reference.
0.005≤P<0.05,
0.001≤P<0.005,
P<0.001.
Findings from main analyses generally remained the same when restricting the analysis to participants who provided fasting blood, who were selected as controls in previous case-control studies or who reported no history of hypertension or hypercholesterolemia (Supplementary Table 2). The proportion of former drinkers was 2.4%, 2.5% and 8.8% in NHS, NHSII and HPFS, respectively. Excluding these former drinkers or excluding all nondrinkers did not change the results substantially (Supplementary Table 2). The adjustment of neighborhood SES did not change the results either.
We observed the favorable associations between alcohol and biomarkers to be persistent in never smokers and slightly more pronounced in women and older individuals (Supplementary Figure 3 and 4). Although C-peptide and CRP were not significantly associated with alcohol intake in main analyses, we observed a lower C-peptide in women, never smokers and participants with obesity, and a lower CRP in older participants and never smokers.
There were slightly positive correlations between consumption of different types of beverages. The correlation coefficients were up to 0.1, except that between white wine and red wine around 0.2 to 0.3. In our population, wine drinkers had a healthier lifestyle and a higher SES than liquor and beer drinkers (Supplementary Table 3). After adjusting for these potential confounders and mutually adjusting for types of alcoholic beverages, wine, especially red wine, was more profoundly associated with lower concentrations of proinflammatory markers, while beer consumption had weaker favorable to null associations with blood lipids and adiponectin. Liquor was associated with higher C-peptide and interleukin-6, yet equally associated with lower HbA1c and higher HDL-C as other beverages (Figure 1). This pattern persisted when stratified by sex, age, smoking or alcohol intake level, and became even clearer in the substitution analyses (Supplementary Table 4).
Figure 1.
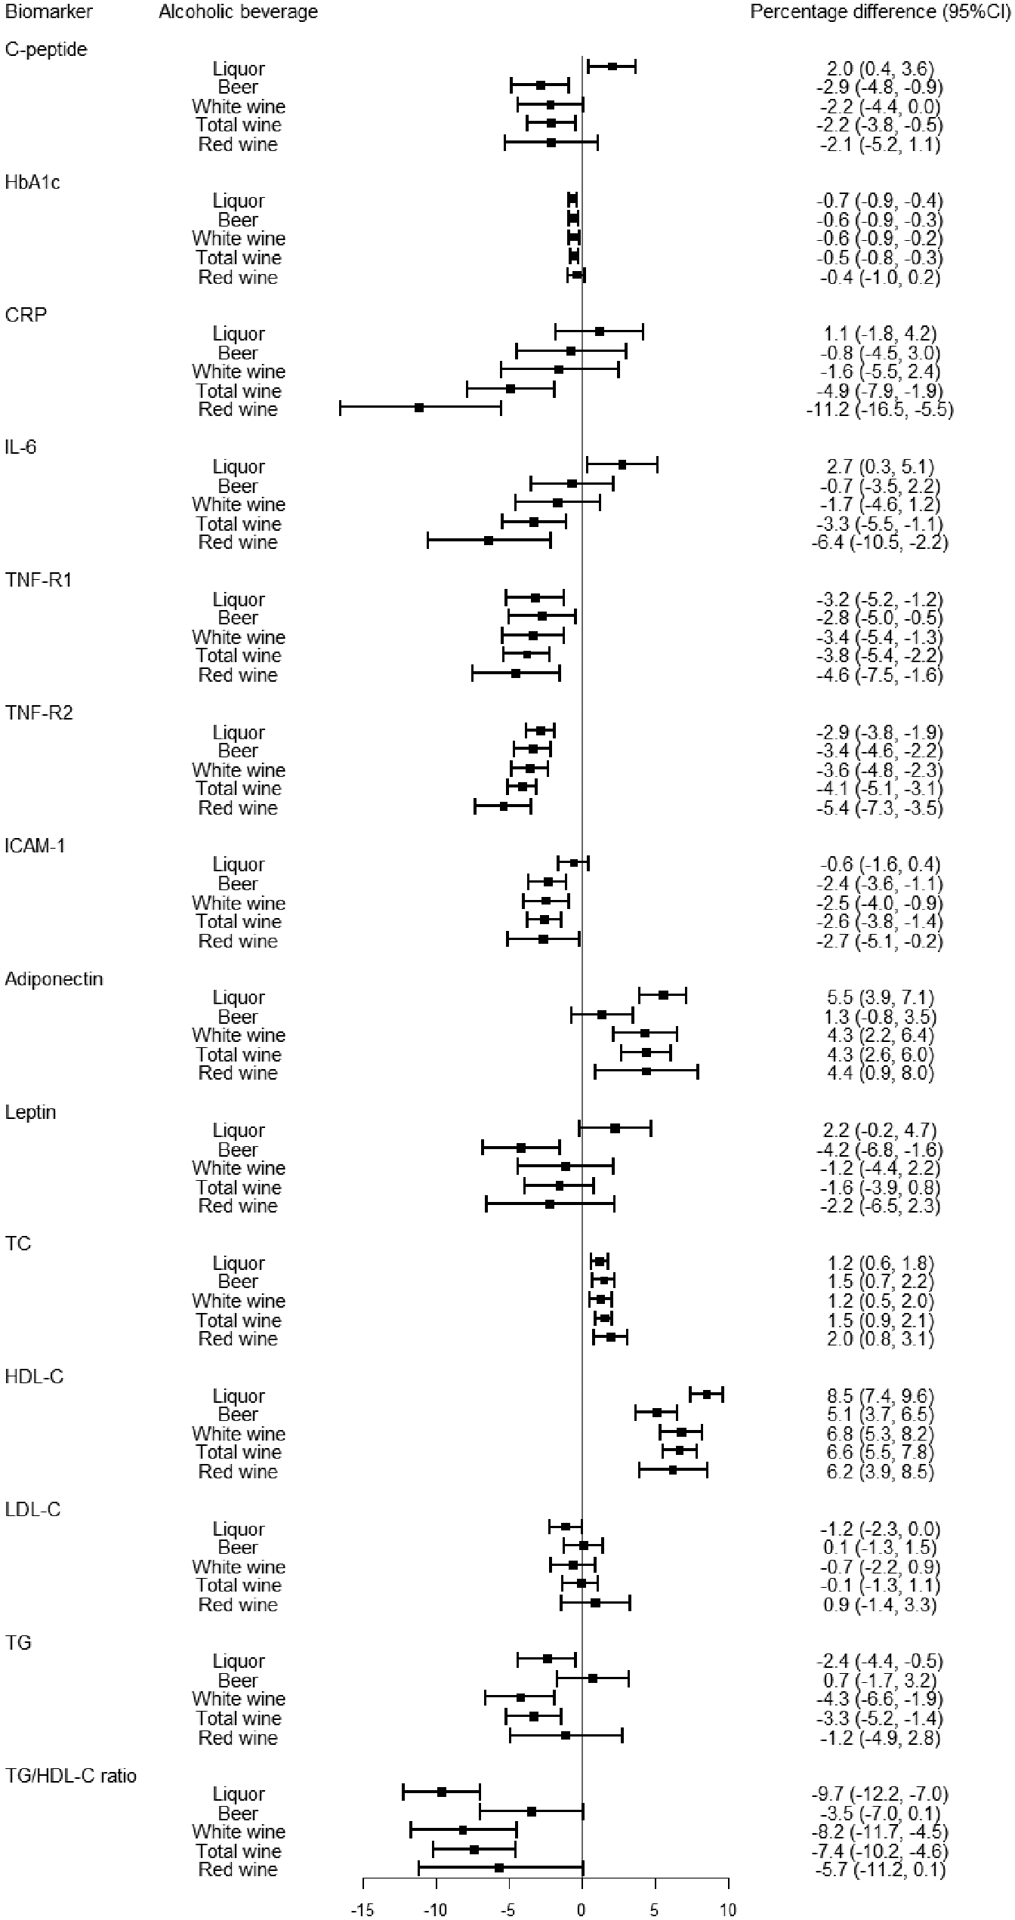
Percentage of differences (95%CIs) in biomarker concentrations associated with 1 serving/d of each type of alcoholic beverage. Estimates were adjusted for the same set of covariates as Model 2 in Table 2, with SES additionally adjusted.
Alcohol consumption levels differed across drinking pattern groups: the median was 8.8, 7.3, 2.2 and 1.0 servings/week for binge and regular, nonbinge and regular, binge and nonregular, and nonbinge and nonregular drinking groups, respectively. After further adjusting for the quantity of alcohol consumed, we found greater inverse associations for the two regular drinking groups than the two nonregular drinking groups (Table 3). Among regular drinkers, the biomarker concentrations were largely similar for binge and nonbinge drinkers, except for a lower TG and TG/HDL-C ratio were observed only in nonbinge drinkers. In HPFS, the proportion of alcohol consumed with meals did not show significant associations with biomarker concentrations (Supplementary Table 5).
Table 3.
Percentage of differences (95%CIs) in biomarker concentrations associated with drinking pattern
| Non drinkers (n=12,068) |
Binge and nonregular drinking (n=4821) |
Nonbinge and nonregular drinking (n=15,479) |
Binge and regular drinking (n=4350) |
Nonbinge and regular drinking (n=4908) |
|
|---|---|---|---|---|---|
| Insulinemic/glycemic markers | |||||
| C-peptide | |||||
| n | 3086 | 983 | 4645 | 1469 | 2435 |
| Model 1 | 0 (ref) | −3.1 (−6.7, 0.7) | −4.8 (−7.1, −2.5) | −7.5 (−11.2, −3.6) | −10.4 (−13.3, −7.4) |
| Model 2 | 0 (ref) | −2.7 (−6.1, 0.8) | −1.0 (−3.2, 1.2) | −3.0 (−6.7, 0.8) | −2.9 (−5.9, 0.1) |
| HbA1c | |||||
| n | 2838 | 977 | 3645 | 1187 | 1426 |
| Model 1 | 0 (ref) | −0.4 (−0.9, 0.1) | −0.3 (−0.6, 0.1) | −0.8 (−1.3, −0.2) | −0.8 (−1.3, −0.3) |
| Model 2 | 0 (ref) | −0.4 (−0.8, 0.1) | −0.1 (−0.4, 0.3) | −0.4 (−1.0, 0.1) | −0.3 (−0.8, 0.2) |
| Inflammatory markers | |||||
| CRP | |||||
| n | 4426 | 1498 | 6191 | 1934 | 2560 |
| Model 1 | 0 (ref) | −1.6 (−7.7, 4.9) | −9.2 (−12.9, −5.4) | −18.0 (−23.8, −11.8) | −22.4 (−27.1, −17.5) |
| Model 2 | 0 (ref) | −0.8 (−6.4, 5.1) | −2.4 (−6.0, 1.3) | −6.7 (−12.7, −0.3) | −7.0 (−12.1, −1.5) |
| IL-6 | |||||
| n | 3038 | 1128 | 4067 | 1320 | 1612 |
| Model 1 | 0 (ref) | −4.6 (−8.6, −0.5) | −7.6 (−10.2, −4.9) | −14.3 (−18.5, −9.9) | −14.6 (−18.3, −10.8) |
| Model 2 | 0 (ref) | −3.5 (−7.4, 0.5) | −3.8 (−6.4, −1.1) | −8.3 (−12.7, −3.8) | −6.9 (−10.7, −2.9) |
| TNF-R1 | |||||
| n | 924 | 385 | 1207 | 411 | 433 |
| Model 1 | 0 (ref) | −3.0 (−6.0, 0.0) | −3.4 (−5.5, −1.3) | −6.6 (−10.1, −3.0) | −5.2 (−8.3, −2.1) |
| Model 2 | 0 (ref) | −3.1 (−6.0, −0.2) | −2.2 (−4.2, −0.1) | −5.1 (−8.6, −1.6) | −2.4 (−5.5, 0.8) |
| TNF-R2 | |||||
| n | 2973 | 1074 | 4008 | 1278 | 1536 |
| Model 1 | 0 (ref) | −3.0 (−4.7, −1.3) | −2.9 (−4.0, −1.7) | −8.0 (−9.9, −6.1) | −5.7 (−7.4, −4.0) |
| Model 2 | 0 (ref) | −3.1 (−4.8, −1.3) | −1.9 (−3.0, −0.7) | −6.7 (−8.6, −4.7) | −3.7 (−5.5, −2.0) |
| ICAM-1 | |||||
| n | 1744 | 440 | 2453 | 571 | 1148 |
| Model 1 | 0 (ref) | −0.1 (−2.5, 2.4) | −1.2 (−2.6, 0.3) | −2.1 (−4.8, 0.6) | −4.0 (−6.0, −1.9) |
| Model 2 | 0 (ref) | −1.6 (−3.9, 0.7) | −0.8 (−2.1, 0.6) | −2.1 (−4.6, 0.5) | −1.9 (−3.9, 0.2) |
| Adiponectin | |||||
| n | 3887 | 1359 | 5336 | 1605 | 1921 |
| Model 1 | 0 (ref) | 4.7 (1.8, 7.8) | 5.1 (3.1, 7.1) | 12.0 (8.1, 15.9) | 11.4 (8.1, 14.7) |
| Model 2 | 0 (ref) | 4.0 (1.2, 7.0) | 2.3 (0.4, 4.1) | 7.3 (3.7, 10.9) | 4.9 (1.9, 8.0) |
| Leptin | |||||
| n | 2686 | 983 | 3813 | 935 | 1568 |
| Model 1 | 0 (ref) | −4.1 (−9.2, 1.4) | −7.1 (−10.5, −3.7) | −17.9 (−23.3, −12.2) | −16.5 (−21.1, −11.7) |
| Model 2 | 0 (ref) | −0.8 (−5.0, 3.6) | 3.1 (0.2, 6.1) | −3.2 (−8.2, 2.1) | 1.8 (−2.6, 6.5) |
| Lipid markers | |||||
| TC | |||||
| n | 4313 | 1620 | 5661 | 1640 | 1931 |
| Model 1 | 0 (ref) | 0.3 (−0.8, 1.3) | 0.9 (0.2, 1.6) | 1.7 (0.4, 3.0) | 0.7 (−0.4, 1.9) |
| Model 2 | 0 (ref) | 0.4 (−0.6, 1.3) | 1.2 (0.5, 1.8) | 2.1 (0.9, 3.3) | 1.5 (0.4, 2.6) |
| HDL-C | |||||
| n | 2355 | 766 | 3151 | 1103 | 1388 |
| Model 1 | 0 (ref) | 2.4 (0.1, 4.7) | 3.5 (2.0, 5.0) | 10.5 (7.8, 13.3) | 10.1 (7.8, 12.4) |
| Model 2 | 0 (ref) | 2.3 (0.2, 4.5) | 1.6 (0.3, 3.0) | 7.6 (5.1, 10.2) | 5.4 (3.4, 7.6) |
| LDL-C | |||||
| n | 1930 | 570 | 2668 | 819 | 1304 |
| Model 1 | 0 (ref) | −2.1 (−4.7, 0.5) | 0.7 (−1.0, 2.3) | −0.5 (−3.3, 2.4) | −0.7 (−3.0, 1.7) |
| Model 2 | 0 (ref) | −1.8 (−4.1, 0.7) | 1.4 (−0.1, 2.9) | 1.2 (−1.5, 4.0) | 1.6 (−0.6, 3.8) |
| TG | |||||
| n | 3027 | 1133 | 3818 | 1132 | 1240 |
| Model 1 | 0 (ref) | −3.6 (−6.9, −0.1) | −6.4 (−8.7, −4.2) | −6.2 (−10.3, −2.0) | −14.0 (−17.3, −10.6) |
| Model 2 | 0 (ref) | −2.0 (−5.1, 1.2) | −2.1 (−4.3, 0.0) | −0.4 (−4.4, 3.7) | −5.4 (−8.7, −1.9) |
| TG/HDL-C ratio | |||||
| n | 1644 | 529 | 2255 | 743 | 1019 |
| Model 1 | 0 (ref) | −4.2 (−10.3, 2.3) | −8.9 (−12.6, −5.0) | −12.2 (−18.4, −5.5) | −21.7 (−26.3, −16.8) |
| Model 2 | 0 (ref) | −3.3 (−8.9, 2.7) | −3.4 (−7.0, 0.4) | −3.6 (−9.9, 3.1) | −10.0 (−14.9, −4.8) |
Adjusted for the same set of covariates as in Table 2 main analysis. Alcohol intake level was additionally adjusted (continuous). CRP, C-reactive protein; IL-6, interleukin-6; TNF-R1, tumor necrosis factor receptor 1; TNF-R2, tumor necrosis factor receptor 2; ICAM-1, intracellular adhesion molecule 1; TC, total cholesterol; HDL-C, HDL-cholesterol; LDL-C, LDL-cholesterol; TG, triglyceride. Ref, reference.
Discussion
In three large US cohorts of individuals without major chronic diseases, we observed favorable profiles of insulinemic/glycemic, inflammatory markers and blood lipids for light to moderate alcohol consumption, starting from <1 serving/d, and extending to higher intake levels in a generally linear manner. The associations varied by types of alcoholic beverages and pattern of drinking. Wine, especially red wine consumption, had the strongest association with lower inflammation. Beer showed less to null benefit in blood lipids and adiponectin. Liquor might instead be related to insulin resistance (higher C-peptide) and higher inflammation (measured using IL-6), yet it was equally associated with lower HbA1c and higher HDL-C as other beverages. Regular drinking was associated with a better biomarker profile than nonregular drinking independent of the quantity consumed.
Different upper limits for moderate drinking across countries reflect uncertainty in the dose-response relationship between alcohol and health (e.g.,14 servings/week or 198g/week for men in the US, 100g/week in China, 210 and 280g/week in France and Poland) [24]. The intake in our population was modest, with the mean intake of 3 servings/d in the highest category and only 4% women and 15% men drank more than 2 servings/d. Thus, our data supporting favorable associations were restricted to this level, and could not provide information for higher intakes. Within this range, we found the relationship between alcohol and most biomarkers to be monotonic and statistically linear, although the non-linear associations with CRP and IL-6, complex interactions between biomarkers, and the opposite effects of biomarkers and acetaldehyde could possibly underlie non-linear associations between alcohol and clinical outcomes. Assuming linearity, the magnitude of our associations was larger than in other studies. For example, a study of 726 diabetic patients in HPFS found a 1 serving/d increment in alcohol intake was associated with a 2.05 mg/dL higher HDL-C [10], yet with a 3.83 mg/dL (7.1% * 54 mg/dL in nondrinkers) higher HDL-C in our population of over 41,000 healthy men and women. Two meta-analyses of RCTs in healthy individuals estimated 1 serving/d of alcohol increased HDL-C by 2.00 and 1.83 mg/dL among mostly young male participants [3, 25]. Besides residual confounding, the larger magnitude in our study may stem from the predominantly older female participants as opposed to young males. This aligns with our finding of stronger associations in women and older participants, which might be due to ethanol metabolism or beverage preferences [26, 27]. It is also likely that habitual alcohol intake might confer accumulated effects on biomarkers not fully captured by short-term interventions in those RCTs (mostly <8 weeks). HDL-C has been recognized as one of the most important biomarkers mediating the relationship between alcohol intake and CVD mortality [28]. The higher HDL-C associated with a 1 serving/d of alcohol consumption is greater than currently available pharmacological studies (e.g., one FDA-approved therapy for low HDL-C patients, fibrates, increased HDL-C by 2.6 mg/dL [29]), but we do not encourage intentionally increasing HDL-C through heavy consumption of alcohol, as higher risks of several cancer and injuries should also be taken into consideration.
Ethanol has been shown to increase the transport rate of lipoproteins and lipoprotein lipase activity to influence levels of HDL-C and TG [30]. It reduces HbA1c by suppressing the acute rise in blood glucose after meals and increasing early insulin response [31]. Also, adiponectin is an insulin sensitizer. Ethanol increases expression of ADIPOQ gene in adipose tissue [32] and suppresses the synthesis of proinflammatory cytokines and chemokines [33]. The associations with inflammation might be attributed to compounds other than ethanol in alcoholic beverages as well, such as polyphenols, which have anti-inflammatory and anti-oxidative potential [34]. Polyphenols are richer in red wine (101mg/100mL) than white wine (10mg/100mL) and beer (4mg/100mL) while almost undetectable in liquor [35], possibly contributing to the gradient observed across the alcoholic beverages with inflammatory markers.
Contrary to the more established relationship between alcohol consumption and HDL-C concentrations and glycemic control, more inconsistency exists in the relatively understudied area of alcohol and inflammation, and we hypothesize it is at least partially due to the influence of the type of alcoholic beverages consumed. For example, RCTs showed red wine but not gin (30g daily for 4 weeks) reduced CRP and ICAM-1 in healthy individuals [6], and IL-6 in individuals at high risk of CVD [36]. Similarly, white wine but not gin (30g daily for 4 weeks) reduced CRP, IL-6 and ICAM-1 [37]. Besides, RCTs comparing regular beer/red wine with their dealcoholized versions and water indicated both ethanol and non-ethanol contents contributed to anti-inflammation, likely in a synergistic way [36, 38]. In real-world settings, the type of alcoholic beverages mainly consumed is often impacted by SES and correlates with overall lifestyle. Wine drinkers in our population had a higher SES and healthier lifestyle than liquor and beer drinkers, consistent with an earlier report in the US [39]. However, variation by beverages remained when SES and lifestyle were adjusted, and our cohorts being quite homogeneous in these factors likely minimized the potential for residual confounding. Although drinking pattern could also be different across beverages, the percentage of regular drinkers among wine drinkers was actually lower than in drinkers of other alcoholic beverages (26.4 vs 37.9 and 30.6 for liquor and beer), which should have biased our results toward smaller differences between beverages.Drinking more frequently or distributing the total intake into more days and drinking with meals have been hypothesized to be healthier patterns of alcohol consumption, due to slower absorption and lower peak concentration of alcohol [40]. A prospective cohort study among UK Biobank participants found a higher drinking habit score, jointly defined by frequency ≥3 days/week and drinking with meals, was associated with lower all-cause mortality, CVD mortality and cancer mortality, during 9 years of follow-up [7]. Previous analyses in HPFS found, even stratified by total alcohol intake, drinking ≥3 days/week was associated with a lower risk of diabetes and myocardial infarction during 12 years of follow-up [41, 42]. However, neither HPFS study reported an apparent benefit of drinking with meals, in line with the current study.
The strengths of our study include the measurement of a comprehensive set of biomarkers relevant to multiple mechanisms in cardiometabolic disorders, detailed information collected on types of alcoholic beverages and various aspects of drinking pattern, and a large sample size comprising both men and women empowering these separate analyses. A series of sensitivity analyses provided evidence against alternative explanations such as “sick quitters” effects and confounding by SES, and supported the robustness of our findings. Cross-sectional designs usually have a limited ability to infer causality. However, the repeated assessment of alcohol and covariates gave us a unique opportunity to conduct the change analysis, and its consistency with the main analysis led to more confidence in true causality. Besides, alcohol affects blood biomarkers rather quickly, reducing the possibility of reverse causation, and also making cross-sectional analysis probably more relevant than follow-up for decades. Along with careful adjustment of confounders in models, our cohorts being homogeneous in race, SES and lifestyle mitigated the concern about confounding. However, the generalizability of our study was also limited to populations with similar characteristics and cannot be extrapolated to heavy drinking populations. It should be noted that there are intricate mediations/interactions among the assessed biomarkers and all of these biomarkers collectively contribute to cardiovascular risks. Therefore, when interpreting our findings, the specific estimate for each individual biomarker might be less important than the overall biomarker profile.
In conclusion, although heavy alcohol intake has been associated with several cancers and total mortality, moderate alcohol intake was associated with favorable profiles of insulinemic/glycemic and inflammatory markers and blood lipids. Drinking wine and drinking more than 3 days per week showed stronger associations. Future studies on modification by beverage type and drinking pattern are warranted to confirm our findings, and studies among younger, more diverse populations and heavy drinking populations are encouraged to extend our findings.
Supplementary Material
Acknowledgments
We would like to thank the participants and staff of the NHS, NHSII, and HPFS for their valuable contributions.
Funding
The Nurses’ Health Study is supported by NIH grants UM1 CA186107 and R01 CA49449. The Nurses’ Health Study II is supported by NIH grants U01 CA176726 and R01 CA67262. The Health Professionals Follow-Up Study is supported by NIH grant U01 CA167552. This work was in addition supported by NIH grant R00 CA215314 (to MS), American Cancer Society Mentored Research Scholar grant MRSG-17-220-01—NEC (to MS), NIH grant R37 CA246175 (to YC), and a research grant from the Ottogi Ham Taiho Foundation (to JH). The content is solely the responsibility of the authors and does not necessarily represent the official views of the National Institutes of Health. The authors assume full responsibility for the analyses and interpretation of these data. The funding sources played no role in the study design, data collection, data analysis, and interpretation of results, or the decisions made in preparation and submission of the article.
Footnotes
Conflict of interest
We declare that we have no conflicts of interest.
Ethical approval
All procedures performed in studies involving human participants were in accordance with the ethical standards of the institutional and national research committee and with the 1964 Helsinki declaration and its later amendments or comparable ethical standards.
Informed consent
Informed consent was obtained from all individual participants included in the study.
References:
- 1.U.S. Department of Agriculture and U.S. Department of Health and Human Services. Dietary Guidelines for Americans, 2020–2025. 9th Edition. December 2020. Available at DietaryGuidelines.gov. [Google Scholar]
- 2.Hoek AG, van Oort S, Mukamal KJ, Beulens JWJ. Alcohol Consumption and Cardiovascular Disease Risk: Placing New Data in Context. Curr Atheroscler Rep. 2022;24(1):51–9. doi: 10.1007/s11883-022-00992-1 [DOI] [PMC free article] [PubMed] [Google Scholar]
- 3.Brien SE, Ronksley PE, Turner BJ, Mukamal KJ, Ghali WA. Effect of alcohol consumption on biological markers associated with risk of coronary heart disease: systematic review and meta-analysis of interventional studies. Bmj. 2011;342:d636. doi: 10.1136/bmj.d636 [DOI] [PMC free article] [PubMed] [Google Scholar]
- 4.Schrieks IC, Heil AL, Hendriks HF, Mukamal KJ, Beulens JW. The effect of alcohol consumption on insulin sensitivity and glycemic status: a systematic review and meta-analysis of intervention studies. Diabetes Care. 2015;38(4):723–32. doi: 10.2337/dc14-1556 [DOI] [PubMed] [Google Scholar]
- 5.Costanzo S, Di Castelnuovo A, Donati MB, Iacoviello L, de Gaetano G. Wine, beer or spirit drinking in relation to fatal and non-fatal cardiovascular events: a meta-analysis. Eur J Epidemiol. 2011;26(11):833–50. doi: 10.1007/s10654-011-9631-0 [DOI] [PubMed] [Google Scholar]
- 6.Estruch R, Sacanella E, Badia E, et al. Different effects of red wine and gin consumption on inflammatory biomarkers of atherosclerosis: a prospective randomized crossover trial. Effects of wine on inflammatory markers. Atherosclerosis. 2004;175(1):117–23. doi: 10.1016/j.atherosclerosis.2004.03.006 [DOI] [PubMed] [Google Scholar]
- 7.Ma H, Li X, Zhou T, et al. Alcohol Consumption Levels as Compared With Drinking Habits in Predicting All-Cause Mortality and Cause-Specific Mortality in Current Drinkers. Mayo Clin Proc. 2021;96(7):1758–69. doi: 10.1016/j.mayocp.2021.02.011 [DOI] [PMC free article] [PubMed] [Google Scholar]
- 8.Rimm EB, Klatsky A, Grobbee D, Stampfer MJ. Review of moderate alcohol consumption and reduced risk of coronary heart disease: is the effect due to beer, wine, or spirits. Bmj. 1996;312(7033):731–6. doi: 10.1136/bmj.312.7033.731 [DOI] [PMC free article] [PubMed] [Google Scholar]
- 9.Pai JK, Hankinson SE, Thadhani R, Rifai N, Pischon T, Rimm EB. Moderate alcohol consumption and lower levels of inflammatory markers in US men and women. Atherosclerosis. 2006;186(1):113–20. doi: 10.1016/j.atherosclerosis.2005.06.037 [DOI] [PubMed] [Google Scholar]
- 10.Shai I, Rimm EB, Schulze MB, Rifai N, Stampfer MJ, Hu FB. Moderate alcohol intake and markers of inflammation and endothelial dysfunction among diabetic men. Diabetologia. 2004;47(10):1760–7. doi: 10.1007/s00125-004-1526-0 [DOI] [PubMed] [Google Scholar]
- 11.Bao Y, Bertoia ML, Lenart EB, et al. Origin, Methods, and Evolution of the Three Nurses’ Health Studies. Am J Public Health. 2016;106(9):1573–81. doi: 10.2105/ajph.2016.303338 [DOI] [PMC free article] [PubMed] [Google Scholar]
- 12.Rimm EB, Giovannucci EL, Willett WC, et al. Prospective study of alcohol consumption and risk of coronary disease in men. Lancet (London, England). 1991;338(8765):464–8. doi: 10.1016/0140-6736(91)90542-w [DOI] [PubMed] [Google Scholar]
- 13.Hunter DJ, Hankinson SE, Hough H, et al. A prospective study of NAT2 acetylation genotype, cigarette smoking, and risk of breast cancer. Carcinogenesis. 1997;18(11):2127–32. doi: 10.1093/carcin/18.11.2127 [DOI] [PubMed] [Google Scholar]
- 14.Willett WC, Sampson L, Stampfer MJ, et al. Reproducibility and validity of a semiquantitative food frequency questionnaire. American journal of epidemiology. 1985;122(1):51–65. doi: 10.1093/oxfordjournals.aje.a114086 [DOI] [PubMed] [Google Scholar]
- 15.Mukamal KJ, Jensen MK, Grønbaek M, et al. Drinking frequency, mediating biomarkers, and risk of myocardial infarction in women and men. Circulation. 2005;112(10):1406–13. doi: 10.1161/circulationaha.105.537704 [DOI] [PubMed] [Google Scholar]
- 16.Giovannucci E, Colditz G, Stampfer MJ, et al. The assessment of alcohol consumption by a simple self-administered questionnaire. American journal of epidemiology. 1991;133(8):810–7. doi: 10.1093/oxfordjournals.aje.a115960 [DOI] [PubMed] [Google Scholar]
- 17.Nimptsch K, Brand-Miller JC, Franz M, Sampson L, Willett WC, Giovannucci E. Dietary insulin index and insulin load in relation to biomarkers of glycemic control, plasma lipids, and inflammation markers. The American journal of clinical nutrition. 2011;94(1):182–90. doi: 10.3945/ajcn.110.009555 [DOI] [PMC free article] [PubMed] [Google Scholar]
- 18.Rosner B, Cook N, Portman R, Daniels S, Falkner B. Determination of blood pressure percentiles in normal-weight children: some methodological issues. American journal of epidemiology. 2008;167(6):653–66. doi: 10.1093/aje/kwm348 [DOI] [PubMed] [Google Scholar]
- 19.Chiuve SE, Fung TT, Rimm EB, et al. Alternative dietary indices both strongly predict risk of chronic disease. The Journal of nutrition. 2012;142(6):1009–18. doi: 10.3945/jn.111.157222 [DOI] [PMC free article] [PubMed] [Google Scholar]
- 20.Chasan-Taber S, Rimm EB, Stampfer MJ, et al. Reproducibility and validity of a self-administered physical activity questionnaire for male health professionals. Epidemiology (Cambridge, Mass.). 1996;7(1):81–6. doi: 10.1097/00001648-199601000-00014 [DOI] [PubMed] [Google Scholar]
- 21.Rimm EB, Stampfer MJ, Colditz GA, Chute CG, Litin LB, Willett WC. Validity of self-reported waist and hip circumferences in men and women. Epidemiology (Cambridge, Mass.). 1990;1(6):466–73. doi: 10.1097/00001648-199011000-00009 [DOI] [PubMed] [Google Scholar]
- 22.Kim D, Masyn KE, Kawachi I, Laden F, Colditz GA. Neighborhood socioeconomic status and behavioral pathways to risks of colon and rectal cancer in women. Cancer. 2010;116(17):4187–96. doi: 10.1002/cncr.25195 [DOI] [PMC free article] [PubMed] [Google Scholar]
- 23.Song M, Giovannucci E. Substitution analysis in nutritional epidemiology: proceed with caution. Eur J Epidemiol. 2018;33(2):137–40. doi: 10.1007/s10654-018-0371-2 [DOI] [PubMed] [Google Scholar]
- 24.Kalinowski A, Humphreys K. Governmental standard drink definitions and low-risk alcohol consumption guidelines in 37 countries. Addiction. 2016;111(7):1293–8. doi: 10.1111/add.13341 [DOI] [PubMed] [Google Scholar]
- 25.Rimm EB, Williams P, Fosher K, Criqui M, Stampfer MJ. Moderate alcohol intake and lower risk of coronary heart disease: meta-analysis of effects on lipids and haemostatic factors. Bmj. 1999;319(7224):1523–8. doi: 10.1136/bmj.319.7224.1523 [DOI] [PMC free article] [PubMed] [Google Scholar]
- 26.Oneta CM, Pedrosa M, Rüttimann S, Russell RM, Seitz HK. Age and bioavailability of alcohol. Z Gastroenterol. 2001;39(9):783–8. doi: 10.1055/s-2001-17196 [DOI] [PubMed] [Google Scholar]
- 27.Vatsalya V, Byrd ND, Stangl BL, Momenan R, Ramchandani VA. Influence of age and sex on alcohol pharmacokinetics and subjective pharmacodynamic responses following intravenous alcohol exposure in humans. Alcohol. 2023;107:144–52. doi: 10.1016/j.alcohol.2022.08.010 [DOI] [PMC free article] [PubMed] [Google Scholar]
- 28.Di Castelnuovo A, Costanzo S, Bonaccio M, et al. Alcohol intake and total mortality in 142 960 individuals from the MORGAM Project: a population-based study. Addiction. 2022;117(2):312–25. doi: 10.1111/add.15593 [DOI] [PubMed] [Google Scholar]
- 29.Briel M, Ferreira-Gonzalez I, You JJ, et al. Association between change in high density lipoprotein cholesterol and cardiovascular disease morbidity and mortality: systematic review and meta-regression analysis. Bmj. 2009;338:b92. doi: 10.1136/bmj.b92 [DOI] [PMC free article] [PubMed] [Google Scholar]
- 30.De Oliveira ESER, Foster D, McGee Harper M, et al. Alcohol consumption raises HDL cholesterol levels by increasing the transport rate of apolipoproteins A-I and A-II. Circulation. 2000;102(19):2347–52. doi: 10.1161/01.cir.102.19.2347 [DOI] [PubMed] [Google Scholar]
- 31.McMonagle J, Felig P. Effects of ethanol ingestion on glucose tolerance and insulin secretion in normal and diabetic subjects. Metabolism. 1975;24(5):625–32. doi: 10.1016/0026-0495(75)90142-0 [DOI] [PubMed] [Google Scholar]
- 32.Joosten MM, Beulens JW, Kersten S, Hendriks HF. Moderate alcohol consumption increases insulin sensitivity and ADIPOQ expression in postmenopausal women: a randomised, crossover trial. Diabetologia. 2008;51(8):1375–81. doi: 10.1007/s00125-008-1031-y [DOI] [PMC free article] [PubMed] [Google Scholar]
- 33.Imhof A, Koenig W. Alcohol inflammation and coronary heart disease. Addict Biol. 2003;8(3):271–7. doi: 10.1080/13556210310001602176 [DOI] [PubMed] [Google Scholar]
- 34.González R, Ballester I, López-Posadas R, et al. Effects of flavonoids and other polyphenols on inflammation. Crit Rev Food Sci Nutr. 2011;51(4):331–62. doi: 10.1080/10408390903584094 [DOI] [PubMed] [Google Scholar]
- 35.Pérez-Jiménez J, Neveu V, Vos F, Scalbert A. Identification of the 100 richest dietary sources of polyphenols: an application of the Phenol-Explorer database. Eur J Clin Nutr. 2010;64 Suppl 3:S112–20. doi: 10.1038/ejcn.2010.221 [DOI] [PubMed] [Google Scholar]
- 36.Chiva-Blanch G, Urpi-Sarda M, Llorach R, et al. Differential effects of polyphenols and alcohol of red wine on the expression of adhesion molecules and inflammatory cytokines related to atherosclerosis: a randomized clinical trial. The American journal of clinical nutrition. 2012;95(2):326–34. doi: 10.3945/ajcn.111.022889 [DOI] [PubMed] [Google Scholar]
- 37.Vázquez-Agell M, Sacanella E, Tobias E, et al. Inflammatory markers of atherosclerosis are decreased after moderate consumption of cava (sparkling wine) in men with low cardiovascular risk. The Journal of nutrition. 2007;137(10):2279–84. doi: 10.1093/jn/137.10.2279 [DOI] [PubMed] [Google Scholar]
- 38.Chiva-Blanch G, Magraner E, Condines X, et al. Effects of alcohol and polyphenols from beer on atherosclerotic biomarkers in high cardiovascular risk men: a randomized feeding trial. Nutr Metab Cardiovasc Dis. 2015;25(1):36–45. doi: 10.1016/j.numecd.2014.07.008 [DOI] [PubMed] [Google Scholar]
- 39.McCann SE, Sempos C, Freudenheim JL, et al. Alcoholic beverage preference and characteristics of drinkers and nondrinkers in western New York (United States). Nutr Metab Cardiovasc Dis. 2003;13(1):2–11. doi: 10.1016/s0939-4753(03)80162-x [DOI] [PubMed] [Google Scholar]
- 40.Sedman AJ, Wilkinson PK, Sakmar E, Weidler DJ, Wagner JG. Food effects on absorption and metabolism of alcohol. J Stud Alcohol. 1976;37(9):1197–214. doi: 10.15288/jsa.1976.37.1197 [DOI] [PubMed] [Google Scholar]
- 41.Conigrave KM, Hu BF, Camargo CA Jr., Stampfer MJ, Willett WC, Rimm EB. A prospective study of drinking patterns in relation to risk of type 2 diabetes among men. Diabetes. 2001;50(10):2390–5. doi: 10.2337/diabetes.50.10.2390 [DOI] [PubMed] [Google Scholar]
- 42.Mukamal KJ, Conigrave KM, Mittleman MA, et al. Roles of drinking pattern and type of alcohol consumed in coronary heart disease in men. N Engl J Med. 2003;348(2):109–18. doi: 10.1056/NEJMoa022095 [DOI] [PubMed] [Google Scholar]
Associated Data
This section collects any data citations, data availability statements, or supplementary materials included in this article.