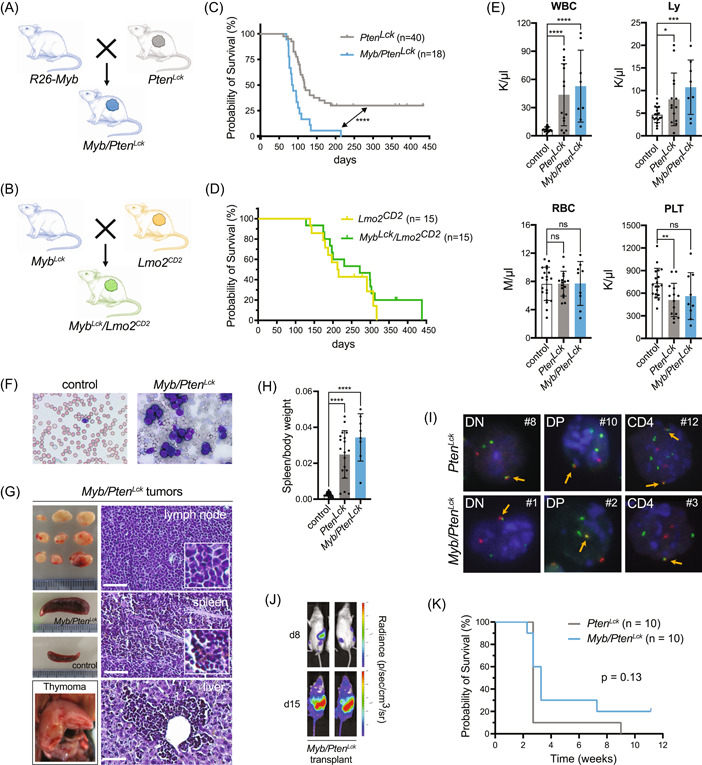
Figure 2.

Myb accelerates Pten‐null T‐cell leukemia in mice. (A) Schematic representation of breeding of R26‐Myb mice, that feature R26‐driven conditional Myb overexpression, with Ptenfl/fl ; Lck‐Cretg/+ (PtenLck ) mice, in order to obtain R26‐Mybtg/tg ; Ptenfl/fl ; Lck‐Cretg/+ (Myb/PtenLck ) mice. (B) Schematic representation of breeding of R26‐Myb mice with CD2‐LMO2tg (Lmo2CD2 ) mice, to generate R26‐Mybtg/tg ; Lck‐Cretg/+ ; CD2‐LMO2tg (MybLck/Lmo2CD2 ) mice. (C) Kaplan–Meier survival curve of PtenLck (in gray) and Myb/PtenLck (in blue) mice. A log‐rank Mantel–Cox test showed that survival of Myb/PtenLck mice was significantly lower. ****p < 0.0001. (D) Kaplan–Meier survival curve of Lmo2CD2 (in yellow) and MybLck/Lmo2CD2 mice (in green). A log‐rank Mantel–Cox test could not show a significant difference between the groups. p = 0.39. (E) Bar chart of peripheral blood (PB) values of nonrecombined cre‐negative control mice, or mice. An unpaired t test revealed a significant increase in circulating white blood cells and lymphocytes of tumor‐carrying and mice compared to nonrecombined controls. No statistical difference was found in the number of RBCs among the models, but a significant decrease in the number of platelets was found in mice, compared to control mice. Each dot represents a different mouse. ****p < 0.0001, ***p = 0.0005, **p = 0.0045, and *p = 0.0267. Error bars denote SEM. (F) Giemsa staining of PB of cre‐negative controls and mice demonstrating an increased number of circulating lymphoblasts in mice. (G) Micrographs of lymphoma, splenomegaly, and thymoma samples of a representative mouse with T‐cell malignancies, and normal spleen of control cre‐negative littermate. Hematoxylin and eosin (H&E) staining of paraformaldehyde‐fixed paraffin sections of lymph node, spleen, and liver of mice. Scale bar: 50 µm. (H) Bar plot depicting the spleen‐to‐body weight ratio of and mice that developed neoplasm and age‐matched cre‐negative littermate control mice. An unpaired t test revealed a significant increase in the spleen‐to‐body weight ratio of and mice compared to controls. ****p < 0.0001. (I) break apart fluorescence in situ hybridization (FISH; see details in Supporting Information S1: Figure S3A) in interphase nuclei of double negative (DN, CD4−CD8−), double positive (DP, CD4+CD8+), or single positive CD4+ primary or T‐ALL transplants. Orange arrows indicate colocalization of the red and green probes that flank the locus, indicative of the normal nontranslocated locus. The tumor number is indicated with a # and corresponds to the tumor list in Supporting Information S2: Table S5. (J) Bioluminescence of NSG mice that were transplanted with 106 tumor cells. Measurements on experimental day 8 and day 15 show a steep increase in bioluminescent signal. (K) Kaplan–Meier survival curve of NSG mice injected with 106 primary tumor cells from 10 and 10 T‐ALLs. A log‐rank Mantel–Cox test showed that there is no significant difference in survival of NSG mice that were either transplanted with or T‐ALLs. p = 0.13. Ly, lymphocytes; ns, not significant; RBC, red blood cells; WBC, white blood cells.
