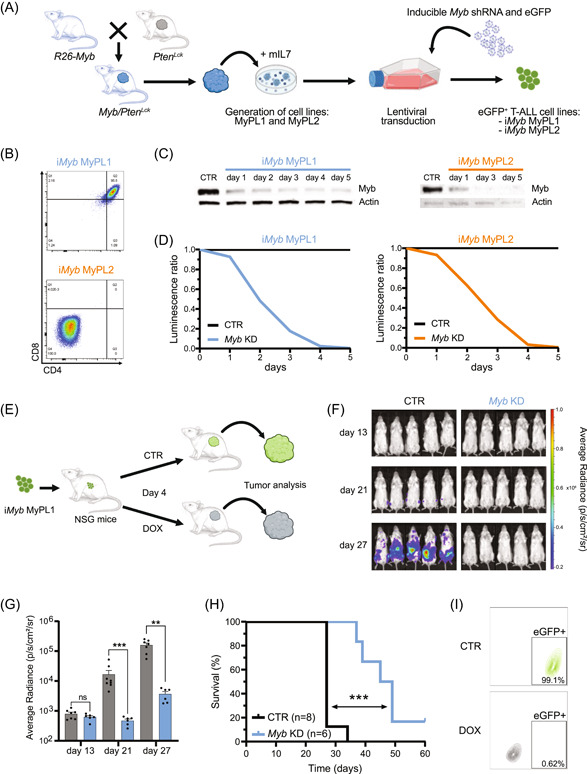
Figure 3.

MYB is essential for the expansion of murine T‐ALL. (A) Schematic representation of the generation of two mouse cell lines, MyPL1 and MyPL2, that were derived from thymomas of R26‐Myb tg/tg ; Pten fl/fl ; Lck‐Cre tg/+ mice that developed T‐ALL. Immortalized cell lines were posteriorly lentivirally transduced with a tetracycline‐inducible vector to express a shRNA targeting Myb (iMyb) and a constitutive eGFP reporter, thus generating iMyb MyPL1 and iMyb MyPL2 cells. (B) Pseudocolor scatterplot of flow cytometry analysis of CD8 (horizontal axis) and CD4 (vertical axis) surface markers on iMyb MyPL1 (double positive CD4+CD8+) and iMyb MyPL2 (double negative CD4−CD8−) cells. (C) Immunoblotting analysis of Myb protein levels in iMyb MyPL1 and iMyb MyPL2 cells. Following doxycycline treatment, both cell lines showed a strong and progressive reduction in Myb protein levels. The control condition (CTR) consists of iMyb MyPL1 or iMyb MyPL2 cells that were cultured without doxycycline in the medium; D1–D5 are 5 consecutive days of treatment with 1 µg/mL of doxycycline hyclate in the culture medium; Actin protein levels were used as loading control. (D) Line chart depicting the ratio of luminescence detected with the CellTiter‐Glo luminescent cell viability assay, normalized to the control condition. Loss of MYB caused a drastic reduction in the number of cells over time, compared to the control. A representative result from three independent experiments is shown. (E) Schematic representation of in vivo Myb knockdown in iMyb MyPL1. This murine T‐ALL cell line (4 × 10⁵/mouse) was transplanted intravenously into NSG mice that were randomly assigned, on experimental day 4, to a treatment group that was fed a diet with 200 mg/kg doxycycline (DOX) or to a control group with a standard diet (CTR). (F) Bioluminescence in NSG mice that were transplanted with iMyb MyPL1. Bioluminescence measurements on days 13, 21, and 27 posttransplantation show a steep bioluminescence increase in the control group, but not in the treatment group. (G) Bar chart showing the bioluminescence quantification in control mice (n = 8, in gray) and doxycycline‐treated mice (n = 6, in blue) from panel F. The knockdown of Myb significantly delayed the bioluminescence increase of iMyb MyPL1 cells in NSG mice. A Mann–Whitney test was used for statistical analysis at each timepoint. ns, nonsignificant, p = 0.45; ***p = 0.0007; **p = 0.0012. (H) Kaplan–Meier survival curve of NSG mice that were transplanted with iMyb MYPL1 cells and were treated as described in panel F. The doxycycline‐treated mice survived longer than control mice (median survival of 47 days versus 27 days, respectively), and a log‐rank Mantel–Cox test showed that the difference between groups was statistically significant. ***p = 0.0002. (I) Contour plot of flow cytometry analysis of iMyb MyPL1 tumor cells from control (CTR, in green) or doxycycline‐treated (DOX, in gray) mice showing the eGFP signal on the horizontal axis and the forward scatter area on the vertical axis.
