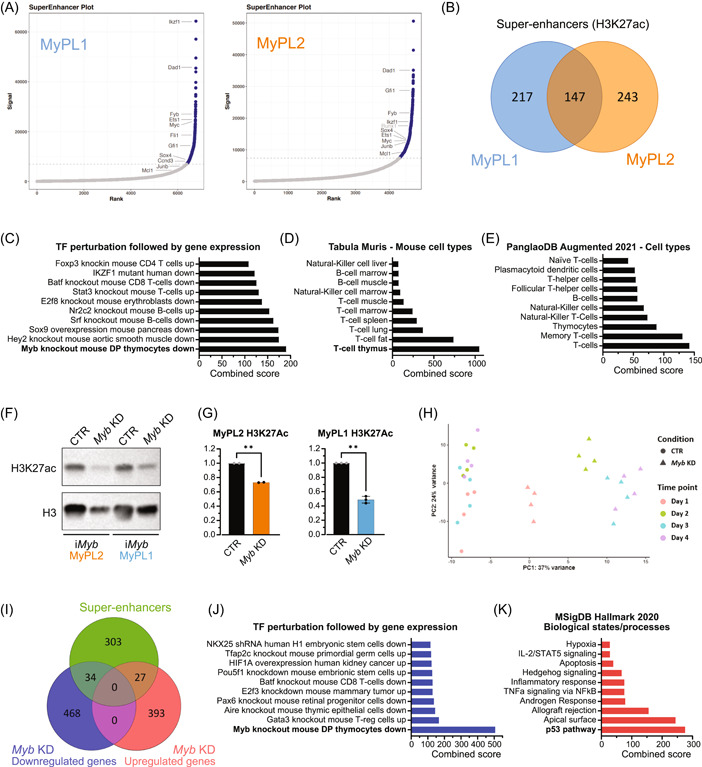
Figure 4.

Loss of Myb decreases H3K27 acetylation and downregulates genes in MYB‐driven super‐enhancers. (A) Hockey stick plot showing the levels of H3K27 acetylation in regulatory regions in the vicinity of genes, highlighting some of the super‐enhancer regions (in blue) found in MyPL1 (CD4+CD8+) and MyPL2 (CD4−CD8−) mouse T‐ALL cell lines. (B) Venn diagram showing the overlap between the super‐enhancers found in MyPL1 and MyPL2. Despite representing cell types in distinct differentiation stages, MyPL1 and MyPL2 T‐ALL cell lines share around 24.2% (147/607) of the super‐enhancers, including genes highlighted in panel A, such as Ets1, Myc, Dad1, Ikzf1, and Sox4. (C–E) Bar graphs of enrichment analysis using the 607 super‐enhancer regions found in MyPL1 and MyPL2 cells. The super‐enhancers found match significantly the genes that are downregulated in mouse thymocytes upon knockout of Myb (C), and appear to be strongly related to T‐cell identity (D, E). (F) Western blot analysis showing the global levels of H3K27 acetylation (H3K27ac) in iMyb MyPL1 and iMyb MyPL2 cells that were either treated with 1 µg/mL doxycycline (Myb KD) for 48 h or not (CTR). Total histone H3 (H3) levels were used as a loading control. (G) Bar graphs showing the normalized (against H3) quantification of epigenetic marks from panel F. **p (iMyb MyPL2) = 0.0063 and *p (iMyb MyPL1) = 0.0029. (H) Principal component (PC) analysis of RNAseq data of iMyb MyPL1 cells that were either treated with 1 µg/mL doxycycline (Myb KD, triangle) or not treated (CTR, circle) for 4 consecutive days and four replicates. Replicates cluster per day of treatment, and transcriptomic changes caused by Myb knockdown increase over time. (I) Venn diagram showing the overlap between the super‐enhancers found in MyPL1 and the up‐ or downregulated genes upon Myb knockdown. (J) Bar graph of enrichment analysis using the 34 genes in super‐enhancer regions that are downregulated following Myb knockdown in iMyb MyPL1 cells. These genes match significantly the genes that are downregulated upon loss of Myb in mouse thymocytes, showing that MYB drives specifically super‐enhancers in genes such as Ccnd3, Stat5a, Ets1, and Ezh2 and promotes their expression. (K) Bar graph of enrichment analysis using the 27 genes in super‐enhancer regions that are upregulated following Myb knockdown in iMyb MyPL1 cells. This gene signature is significantly associated with the p53 pathway.
