Figure 5.

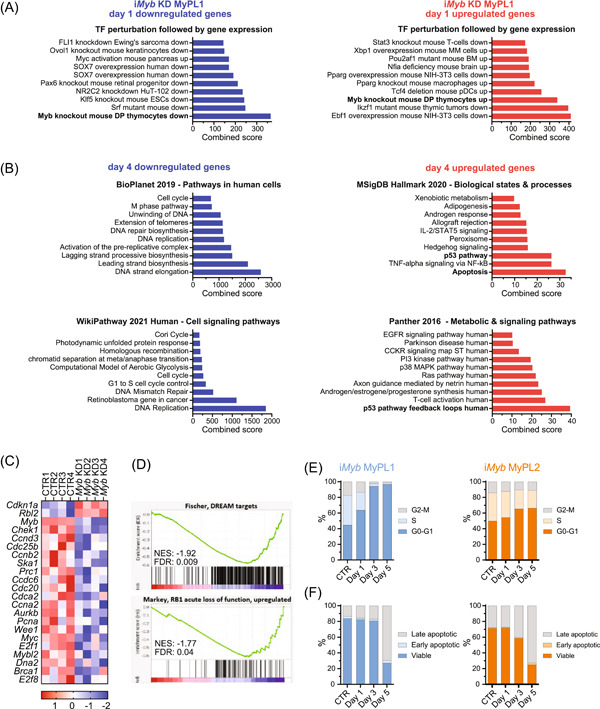
Loss of Myb halts cell cycle progression and induces cell death in murine T‐ALL. (A, B) Bar graphs of enrichment analysis using a gene expression signature of iMyb MyPL1 cells that suffered from Myb knockdown, or not, on experimental day 1 (A) and day 4 (B). Enrichment analysis showed that the gene signature of Myb knockdown in iMyb MyPL1 matches significantly the genes that are affected by Myb knockout in mouse thymocytes (A), both for the downregulated genes (in blue), and the upregulated genes (in red). After 4 days without MYB (B), iMyb MyPL1 cells showed very significant downregulation of genes involved in DNA replication and cell cycle progression (in blue), and an upregulation of genes implicated in the p53 pathway, and in apoptosis (in red). (C) Heatmap of messenger RNA expression of genes that are involved in cell cycle regulation after 4 days in untreated (CTR1‐4) and doxycycline‐treated iMyb MyPL1 cells (Myb KD1‐4). (D) Gene set enrichment analysis of targets of the DREAM complex and upregulated genes upon loss of RB1. (E) Stacked bar chart of the percentage of cells per phase of the cell cycle in untreated (CTR) iMyb MyPL1 (in blue) or iMyb MyPL2 (in orange) cells or in doxycycline‐treated cells on experimental days 1, 3, and 5. Myb knockdown led to a decreased number of cycling cells, as shown by the accumulation of cells in G0/G1, and the reduced proportion of cells at the S and G2/M phases of the cell cycle. A representative result from two independent experiments is shown. (F) Stacked bar chart of the percentage of viable, early apoptotic, or late apoptotic cells (as determined by Annexin/PI staining) in either untreated (CTR), or doxycycline‐treated iMyb MyPL1 or iMyb MyPL2 cells on experimental days 1, 3, and 5. A representative result from two independent experiments is shown. FDRq, false discovery rate q‐value; NES, normalized enrichment score.
