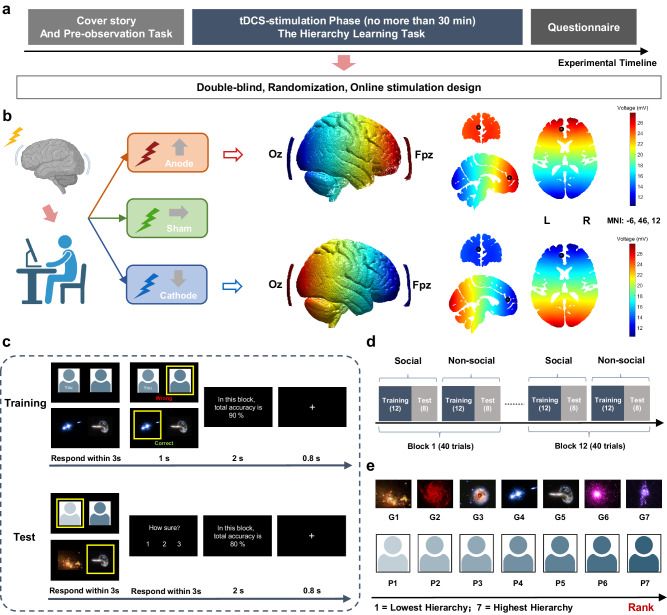
Fig. 1. Illustration of the experimental procedure and behavioral paradigm.
a Participants firstly were given a cover story. They were asked to imagine that they recently had joined a technology company that detected precious minerals in different galaxies. As new members of the company, they were instructed to learn the hierarchical relationships between the staff (Social) and the mineral contents of the different galaxies (Non-social). To familiarize themselves with the company members and galaxies, they were instructed to passively observe all the pictures (7 faces, 7 galaxies) in an pre-observation task. Each picture was randomly presented three times. Next, participants were randomly assigned to the anodal, sham, or cathodal stimulation, and instructed to perform a hierarchy learning task. At the end of the experiment, participants were required to complete questionnaires, including Social Dominance Orientation scale, and post-questions about the task and tDCS stimulation (see Methods for the details). b The Fpz-Oz montage of brain stimulation was chosen based on previous studies as targeting mPFC. Electric field simulation results for anodal and cathodal tDCS shown the simulated voltage distribution over the prefrontal cortex (left), and in coronal, sagittal, and axial slices (right) using the anodal montage with the MNI template brain. The black circle shows the targeted mPFC coordinates from Kumaran et al.15 (MNI: −6, 46, 12). The voltage indicates the strength of tDCS across the brain (L = left; R = right). c There are two phases in the hierarchy learning task. In the Training phase, participants were presented with adjacent items of the hierarchy (i.e., P4 vs P5, G4 vs G5, where P4 = “You”; and G4 = galaxy of rank equal to 4). They had to indicate the person they thought had higher status or the galaxy with more minerals. They received a feedback (correct/wrong) based on their choices allowing them to learn the hierarchical relationships between adjacent items. In the Test phase, participants were required to view non-adjacent items in the hierarchy (i.e., P1 vs P5, G1 vs G5), infer which one was the higher-ranked item, and to rate their confidence in their choice (no feedback was provided). d There are 12 blocks in the task including 12 training trials and 8 test trials in each block. The non-social condition was identical to the social condition except the stimuli were pictures of galaxies. e For the social condition, human faces were gender matched with real facial photos selected (here we use different color of silhouettes for illustration, see Methods for details). For the non-social condition, galaxy pictures were the same for females and males. The galaxy image courtesy of NASA and the Space Telescope Science Institute (STScI, http://hubblesite.org). (1=Lowest in hierarchy, 7=highest in hierarchy).

