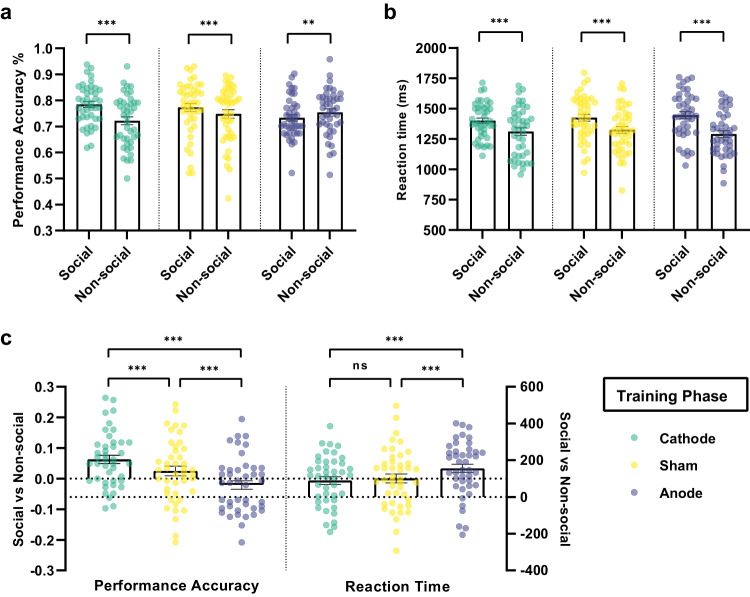
Fig. 2. Effect of tDCS stimulation over mPFC on the Training Phase.
a Performance accuracy (%) across blocks on social and non-social condition of different tDCS groups. b Reaction time (ms) across blocks on social and non-social condition of different tDCS groups. The y-axis of (a) and (b) indicate the raw performance data, with each dot representing an individual participant. The significance levels compare social and non-social conditions. c tDCS modulation of Social compared to Non-social hierarchy learning performance accuracy (left) and reaction time (right) across blocks during Training phase. The y-axis indicates the raw data of social minus non-social condition, with each dot representing an individual participant. The significance levels compare effects among Cathode, Sham, and Anode stimulation on the differences between social and non-social conditions. All significance levels labeled were estimated by the marginal average effect across all individuals and time periods in the panel regression (N = 128: Cathode=42, Sham=44, Anode=42; * indicates p < 0.05, ** indicates p < 0.005, *** indicates p < 0.001, ns indicates non-significant). Error bars indicate standard error of the mean.

