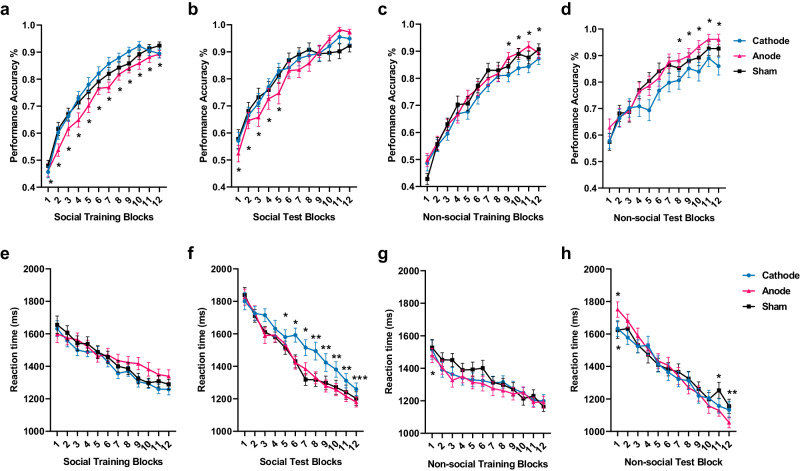
Fig. 5. Effect of tDCS stimulation over mPFC on hierarchy learning from trial block to block.
a Performance accuracy (%) modulated by tDCS from trial block to trial block over consecutive Social Training phase. b Performance accuracy (%) modulated by tDCS from trial block to trial block over consecutive Social Test phase. c Performance accuracy (%) modulated by tDCS from trial block to trial block over consecutive Non-social Training phase. d Performance accuracy (%) modulated by tDCS from trial block to trial block over consecutive Non-social Test phase. e Reaction time (ms) modulated by tDCS from trial block to trial block over consecutive Social Training phase. f Reaction time (ms) modulated by tDCS from trial block to trial block over consecutive Social Test phase. g Reaction time (ms) modulated by tDCS from trial block to trial block over consecutive Non-social Training phase. h Reaction time (ms) modulated by tDCS from trial block to trial block over consecutive Non-social Test phase. The y-axis from (a)–(d) indicates the raw performance data and the y-axis from (e)–(h) indicates reaction time (ms). The significance labels indicate the comparison between Cathode and Sham (on top of the lines), or Anode and Sham (on bottom of the lines). All significance levels were estimated by the average marginal effect across all individuals and time periods in the panel regression. Only significant results are labeled, see Supplementary Table 3−6 for the detailed significance slope comparison results of each block from the model estimation (N = 128: Cathode=42, Sham=44, Anode=42; * indicates p < 0.05, ** indicates p < 0.005, *** indicates p < 0.001). Error bars indicate standard error of the mean.

