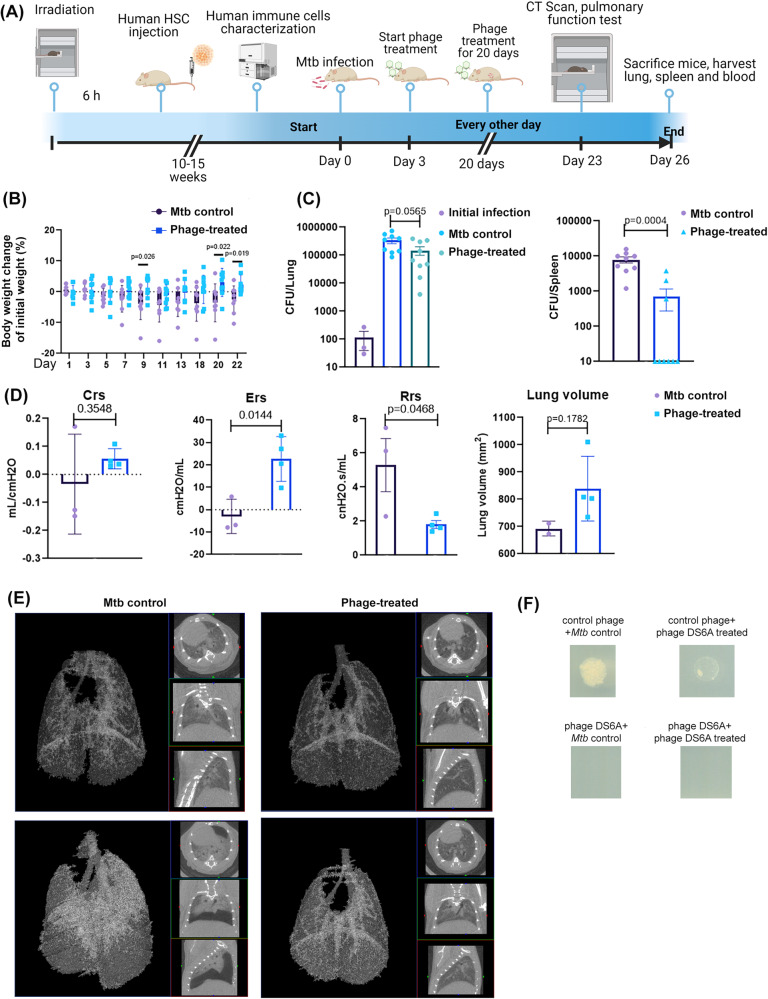
Fig. 4. Phage DS6A is effective at eradicating Mtb in humanized NSG-SGM3 mice.
A Schematic presentation of the animal experiment procedures. H37Rv aerosol infected humanized mice were treated three days after infection with 1 × 10¹¹ pfu of phage DS6A per mouse or equal volume of sterile PBS every other day for eight times. B The mouse body weights were monitored over time, and the body weight change over the initial body weight of the mice are shown as percentages (n = 9 for each group). C The growth of H37Rv in the mice lung and spleen homogenates together with initial infection dose (left panel in purple) are shown (n = 3 for initial infection dose determination; n = 9 for Mtb control and phage-treated group). D Before termination of the experiment, the mice were subjected to pulmonary function testing. The measurements of elastance, compliance, total lung resistance, and total lung volume were collected, and the statistics are shown (n = 3 for Mtb control group, n = 4 for phage-treated group). E CT scans were performed for each mouse, and two representative figures for each each group show the Mtb-infected control mouse and phage-treated mouse lungs, respectively. The left panel of each mouse CT scan figure shows the 3D image, the white areas represent the high-density scan (e.g., tissues), while the black areas represent low density scan (e.g., air). The three small figures in each mouse scan show different angles of scan results. F The colonies from the plates that spread with lung or spleen homogenates of the H37Rv infected control or phage-treated mice were picked and mixed with 1 × 10⁶ pfu of phage DS6A or a negative control phage (phage Chah) in 10 µl 7H9 media and incubated at 37 °C for 1 h. Then the infection cultures were pipetted onto the 7H10 agar plates OADC and incubated at 37 °C for determination of CFUs. The animal experiments were performed four times, and the 3rd and 4th experiments were shown. Except the pulmonary functions were tested once (3rd animal experiment, n = 3 for Mtb control group, and n = 4 for phage DS6A-treated group), the other data are shown as the combined results from the 3rd and 4th experiments (n = 9 for each group). All the statistics are shown as mean ± SEM. Unpaired Student T-test was used to analyze the differences between groups. Statistical significance was defined as *P ≤ 0.05, **P ≤ 0.01, and ***P ≤ 0.001.

