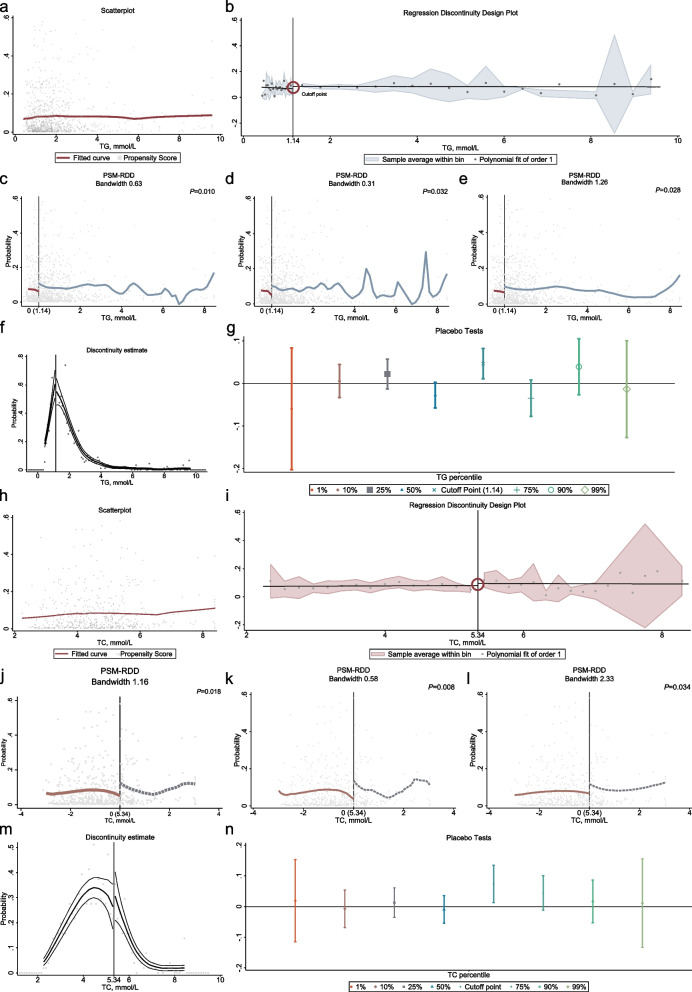
Fig. 3.
Analyzing the Relationship Between TC, TG, and Adverse Outcomes Using Regression Discontinuity Design. a, h Scatterplot Analysis: Total Cholesterol and Probability of Adverse Outcomes, Triglycerides and Probability of Adverse Outcomes. b, i Regression Discontinuity plot: At a triglycerides (TG) level of 1.14 mmol/L, patients exhibited a notable decrease in the risk of adverse outcomes. Similarly, at a total cholesterol (TC) level of 5.34 mmol/L, patients demonstrated a substantial reduction in the risk of adverse outcomes. The dots represent Odds Ratio (OR) values, while the shading represents confidence intervals. c-e, j-i Sensitivity analysis. f, m Continuity tests; (g, n) Placebo tests: The robustness of the final model results is assessed at various percentile values, including 1, 10, 25, 50, 75, 90 and 99%, respectively

