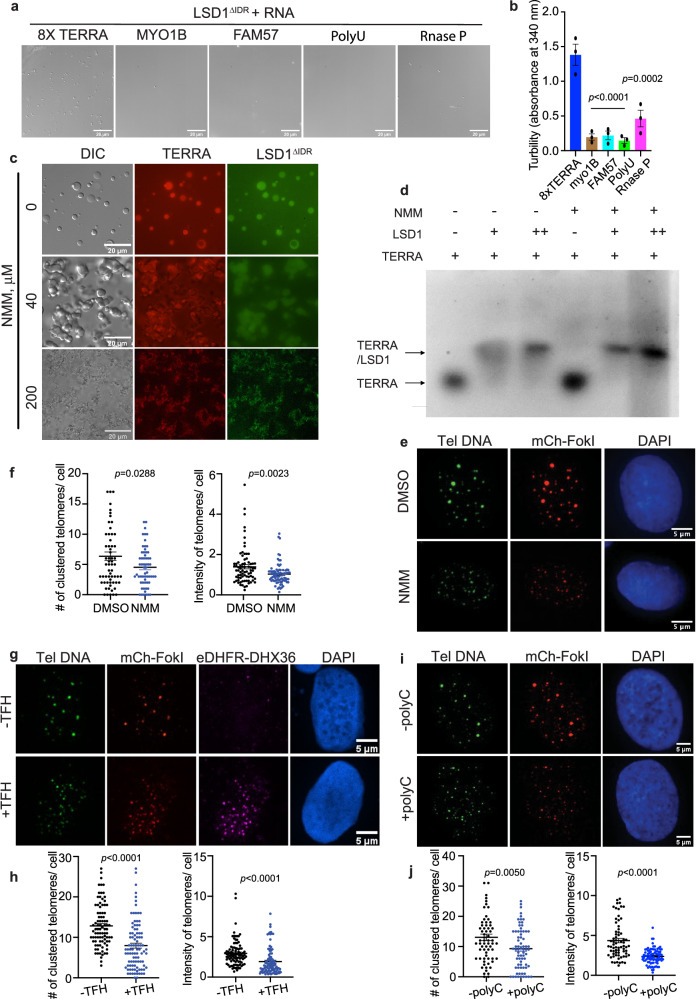
Fig. 5. TERRA G-quadruplex structure is required for LSD1 phase separation and ALT functions.
Representative DIC images (a) and turbidity assay (b) of LSD1ΔIDR (20 μM) with the addition of different RNAs (20 μM). Turbidity measurements are shown as mean ± SEM (n = three independent experiments, one-way ANOVA). c Representative images of fluorescent LSD1ΔIDR (50 μM) with 12× TERRA (25 μM) pretreated with G-quadruplex binding ligand, N-methyl mesoporphyrin IX, (NMM) (n= three independent experiments). d In vitro EMSA of 8X TERRA GG(UUAGGG)8U (+ = 2 μM) alone and in the presence of LSD1 (+ = 10 μM and ++ = 20 μM) and NMM (+ = 200 μM). The 0.75% agarose gel contained Syber Safe dye (10,000:1, Invitrogen) and was performed under the following conditions (60 V, 1 h, 4 °C). The fluorescence data were visualized at 520 nm using an Amersham Imager 600 (AI600) instrument (n = two independent experiments). e Representative images and f quantification of telomere clustering (DNA FISH) after treatment of NMM (200 nM, 24 h) in FokI stable cell line (n = 77 cells for DMSO, n = 80 cells examined for NMM over two independent experiments, two-tailed unpaired t test). g Representative images and h quantification of telomere clustering (DNA FISH) after co-transfection of eDHFR-DHX36, Halo-TRF1 and mCh-FokI with or without TFH treatment in U2OS cells (n = 96 cells for -TFH, n = 99 cells examined for +TFH over three independent experiments, two-tailed unpaired t test). DHX36 are indicated by antibody-based immunostaining. i Representative images and j quantification of telomere clustering (DNA FISH) after co-transfection of polyC with mCh-FokI in U2OS cells (n = 69 cells for -polyC, n = 84 cells for +polyC over three independent experiments, two-tailed unpaired t test). Error bars are mean ± SEM. N.S., not significant. Source data are provided as a Source Data file.

