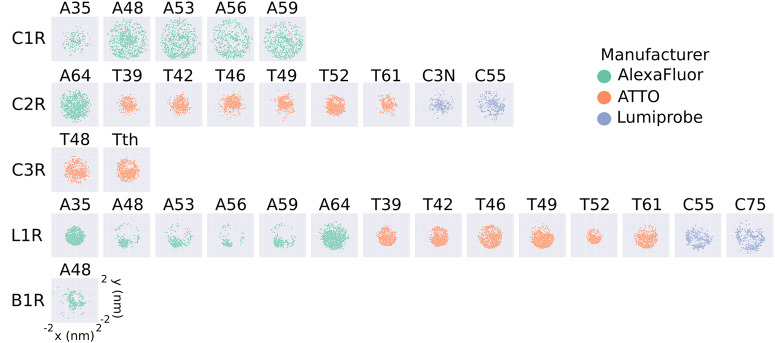
Fig. 1. 2D projections of the position of the fluorophore with respect to the Cα atom.
Projection on the xy-plane of the distance vectors between the Cα atom and the central atom of the fluorophore for the large rotamer libraries generated in this work, which typically contain hundreds of structures (Supplementary Fig. 7). The projections are obtained as the x and y coordinates of the central atom of the fluorophore (O91 for AlexaFluor, C7 for ATTO, and C10 for Lumiprobe), after placing the Cα atom at the origin. Each plot represents a different FRET probe, divided into rows according to linker type (C1R, C2R, C3R, L1R, B1R, from top to bottom), and colored according to the manufacturer (green for AlexaFluor, orange for ATTO, and blue for Lumiprobe).

