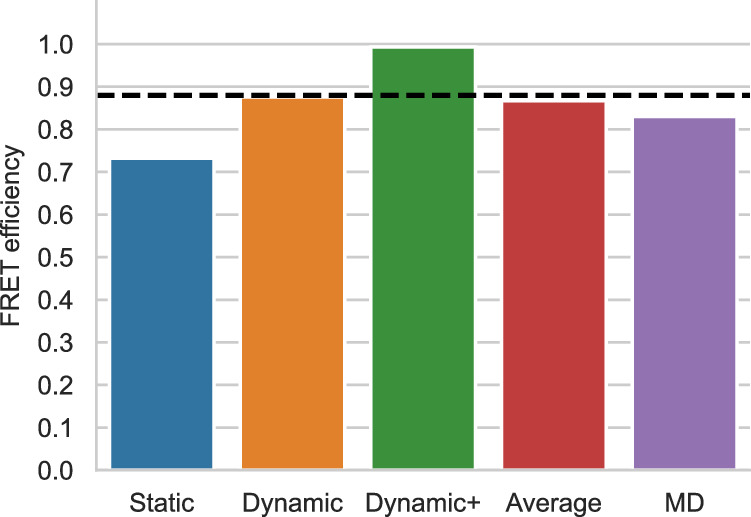
Fig. 3. FRET efficiencies for polyproline 11.

FRET efficiencies calculated using FRETpredict and the MD trajectory of polyproline 11 fluorescently labeled at the terminal residues. We calculated E using the large rotamer libraries and for the different regimes (static, dynamic, and dynamic+, in blue, orange, and green, respectively). The graph also shows the average over the three regimes (red) and the E value obtained from MD simulation with explicit FRET probes (purple). The black dashed line indicates the experimental E value.
