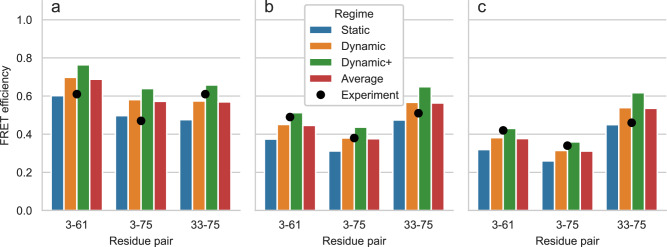
Fig. 4. FRET efficiency for ACTR at three urea concentrations.
FRET efficiency for ACTR at [urea] = 0 M (a), 2.5 M (b), and 5 M (c). The protein is fluorescently labeled at three different pairs of sites: 3-61, 3-75, and 33-75. Bars show FRETpredict estimates of the E values calculated using medium rotamer libraries. Predictions for the static, dynamic, and dynamic+ regimes and their average are shown as blue, orange, green, and red bars, respectively. Black circles show the experimental data from Borgia et al.48.

