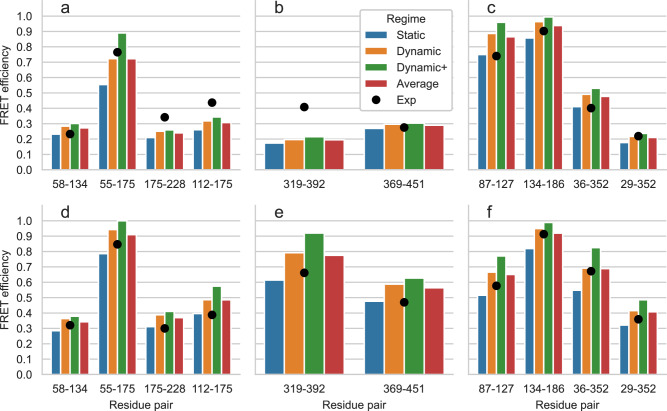
Fig. 6. Predictions of FRET efficiencies for single structures.
FRET efficiency values obtained on the single structures for the open (a–c) and closed (d–f) conformations of HiSiaP (a and d), SBD2 (b and e), and MalE (c and f) for the different residue pairs, using large rotamer libraries. Predictions for the static, dynamic, and dynamic+ regimes and their average are shown as blue, orange, green, and red bars, respectively. Black circles show the experimental reference values from Peter et al.49 for each pair of residues.

