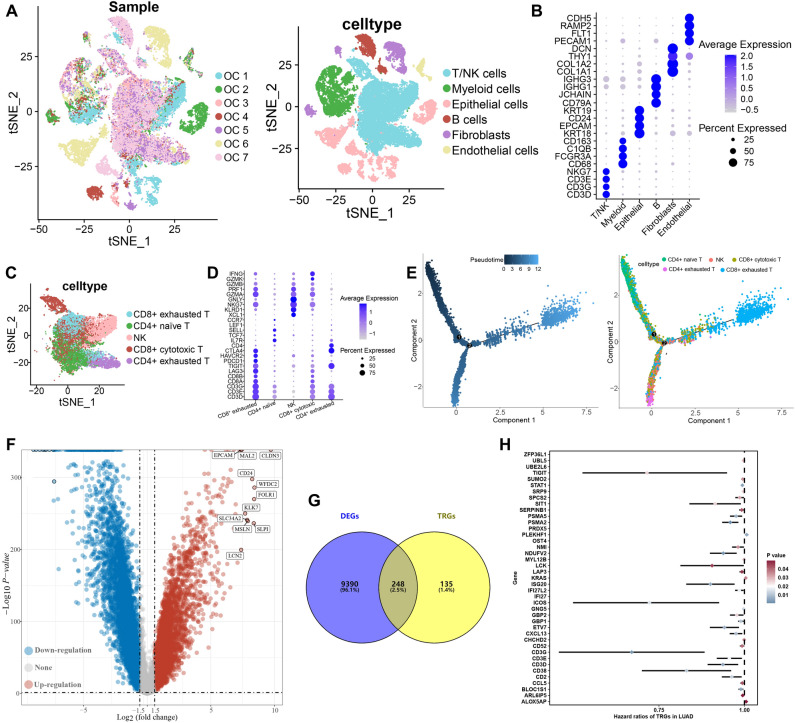
Figure 2.
Identification of TRGs and their prognostic value. (A) t-SNE plot showing the identified cell types of from 7 ovarian cancer sample. (B) Dotplot showing average expression levels of cell marker. (C,D) SNE plot of sub-cell types of T cells and dotplot of expression pattern of cell markers. (E) Developmental trajectory of T cells inferred by monocle, colored by pseudotime and cell subtype. (F) Volcano plot showing DEGs in ovarian cancer. (G) Overlap between DEGs and TRGs. (H) Potential biomarkers identified by univariate cox analysis.

