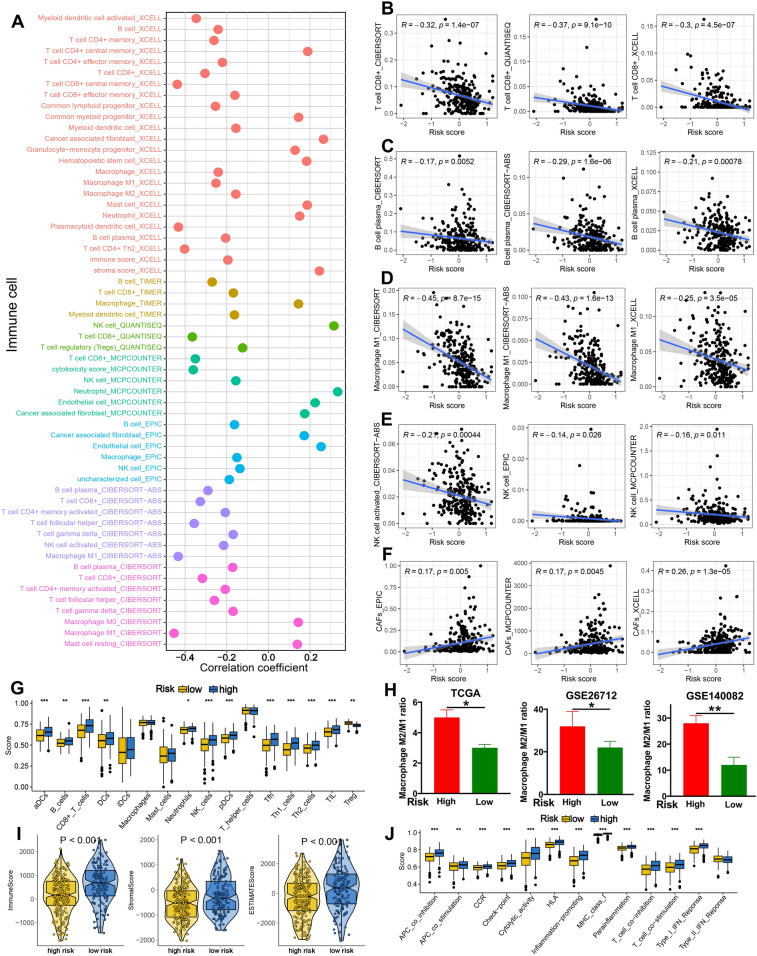
Figure 5.
Correlation between immune microenvironment and TRPS in OC. (A) Seven state-of-the-art algorithms evaluating the correlation between TRPS and immune cell infiltration in OC. (B–F) The correlation between TRPS and the abundance of CD8+ T cells, plasma cells, macrophage M1 and CAFs. (G) The level of immune cells in different TRPS score group based on ssGSEA analysis. (H) The macrophage M2/M1 ratio in different TRPS score group in TCGA, GSE26712 and GSE140082 dataset. (I,J) The stromal score, immune score, ESTIMAE score and immune-related functions score in different TRPS score group. *P < 0.05, **P < 0.01, ***P < 0.001.

