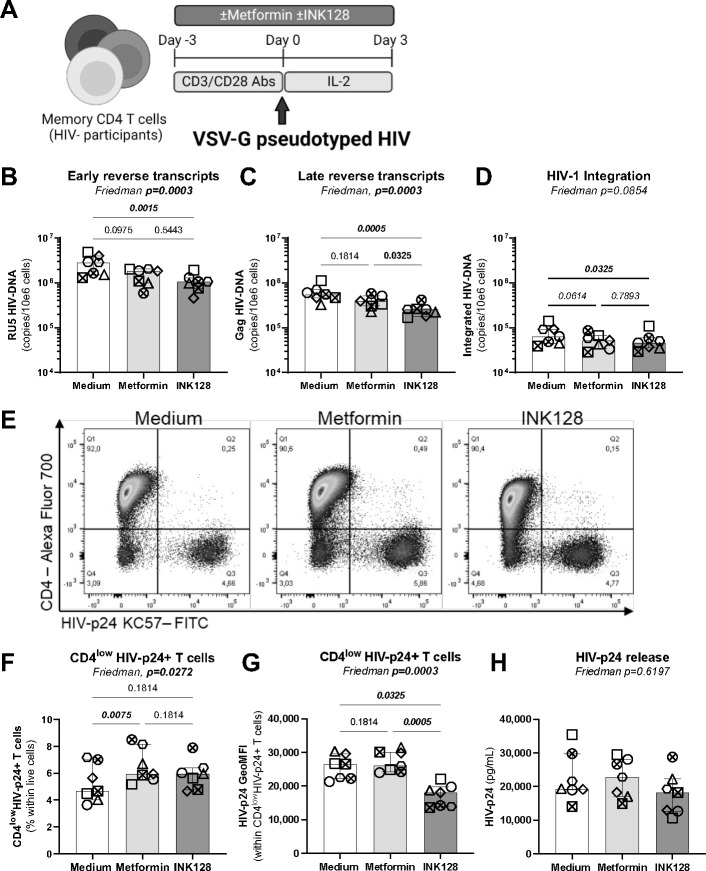
Figure 4: Effects on metformin on single-round HIV-1 infection in vitro.
(A) Shown is the flow chart for the single-round HIV-1 infection in vitro. Briefly, memory CD4+ T-cells from HIV-uninfected donors were stimulated by anti-CD3/CD28 Abs in the absence/presence of metformin (1 mM) or INK128 (50 nM) for 3 days. Then, cells were exposed to a replication-incompetent single-round VSV-G-pseudotyped HIV-1 construct (100 ng HIV-p24/106 cells). Cell-culture supernatants and cells were collected at day 3 post-infection. Shown are levels of early (RU5) (B) and late HIV reverse transcripts (Gag) (C), as well as integrated HIV-DNA (D) quantified by real-time nested PCR. Shown are representative flow cytometry dot plots of intracellular HIV-p24 and surface CD4 expression from one donor (E) and statistical analysis of the productively infected CD4lowHIV-p24+ T-cells in terms of frequencies (F) and the geometric MFI of HIV-p24 expression (G). Shown are absolute HIV-p24 levels in cell culture supernatants quantified by ELISA (H). Each symbol represents one donor (n=7; median ± interquartile range). Friedman and uncorrected Dunn’s multiple comparison p-values are indicated on the graphs

