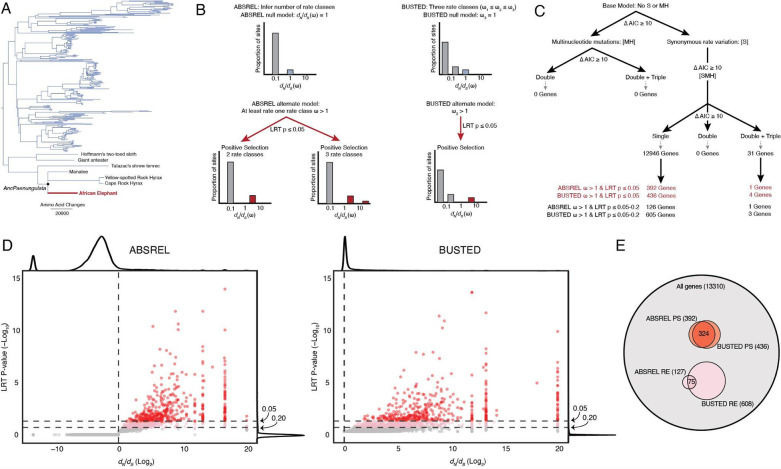
Figure 1. Identification and positively selected and rapidly evolving genes in the elephant lineage.
A. Phylogeny of 261 Eutherian mammals used in selection tests. The Atlantogenatan part of the tree is expanded to show which species of Afrotheria and Xenarthra are included in the analyses. Branch lengths are shown as amino acid changes per lineage. B. Cartoon description of the ABSREL and BUSTED models.
C. Decision tree showing [S], [MH], and [SMH] model selection (inferred with ABSREL) and the number of genes inferred to be positively selected and rapidly evolving.
D. Volcano plot showing the dN/dS rate ratio (Log2) and likelihood ratio test (LRT) P-value (−Log10) for each gene inferred from the best-fitting ABSREL (right) and BUSTED (left) tests in the elephant lineage. Red dots indicate genes with dN/dS>1 and P≤0.05, and dots in pink indicate genes with dN/dS>1 and P=0.051–0.20.
E. Venn diagram showing the number and overlap of genes inferred to be positively selected (PS) or rapidly evolving (RE) by the ABSREL and BUSTED tests.

