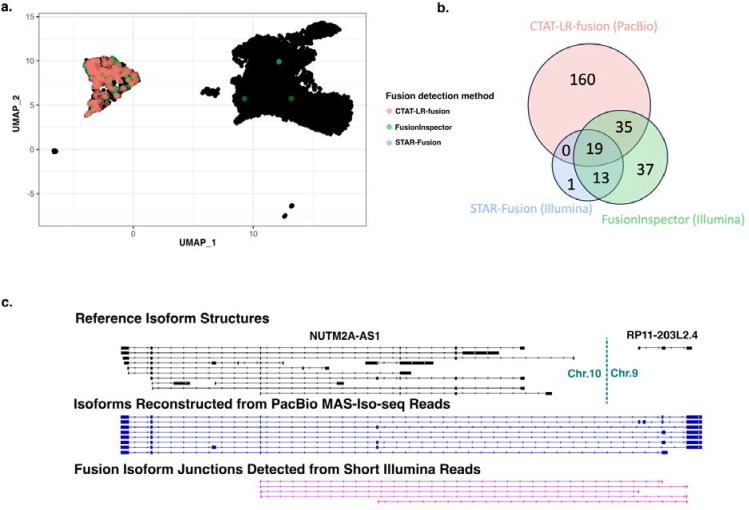
Figure 5: Detection of Fusion NUTM2A-AS1::RP11–203L2.4 in a T-cell infiltrated melanoma tumor sample.
MAS-ISO-seq and matched Illumina RNA-seq data from a melanoma tumor sample M132TS 10x single cell library [published in (Al’Khafaji et al. 2023) were examined for fusion transcripts using CTAT-LR-fusion for PacBio long reads and STAR-Fusion and FusionInspector for Illumina short reads. (A) UMAP for melanoma sample M132TS single cells. Cells identified with the NUTM2A-AS1::RP11–203L2.4 fusion transcript are colored according to the detection method, predominantly labeling the cluster of malignant cells. (B) Venn diagram indicating the numbers of fusion-containing cells according to detection methods. (C) Fusion supporting read alignments and derived transcript isoform structures based on long (center) or short (bottom) read sequences in the context of the FusionInspector modeled gene fusion contig. Gencode v22 reference isoform transcript structures for NUTM2A-AS1 and RP11–203L2.4 genes are shown at top.

