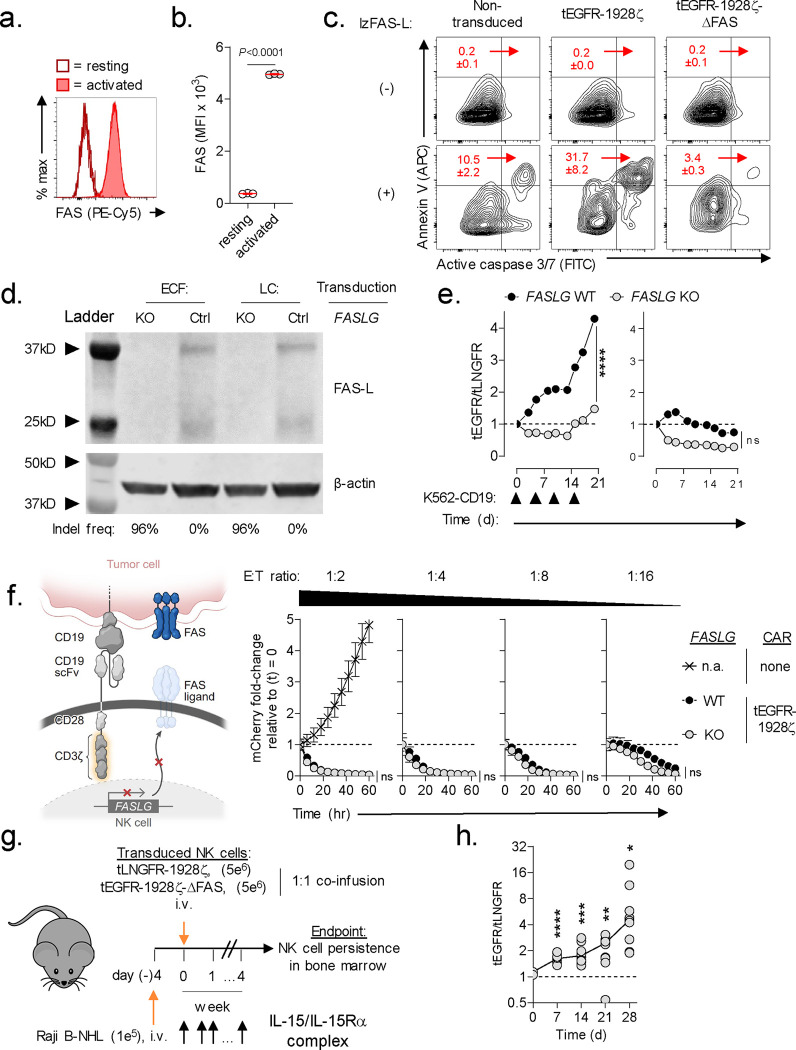
Fig. 5: CAR-NK survival is regulated by a FAS/FAS ligand auto-regulatory circuit.
(a) Representative FACS and (b) summary scatter plot quantifying FAS expression on cord blood-derived human NK cells at rest and 5d following activation with irradiated K562 Clone 9 cells. Data shown as mean ± s.e.m. using n=3 biological replicates per condition. Statistical analysis performed by two-sided Student’s T test. (c) Representative FACS plots quantifying lzFAS-L induced apoptosis in activated non-transduced NK cells or NK cells transduced with tEGFR-1928ζ or tEGFR-1928ζ-ΔFAS. Numbers indicate the mean ± s.e.m. of activated caspase 3/7+/annexin V+ cells for each condition. (d) Western blot for FAS-L protein expression in lysates from FASLG-KO or control (Ctrl) NK cells transduced with tEGFR-1928ζ-ΔFAS (ECF) or tLNGFR-1928ζ (LC). The frequency of frameshift Indels in FASLG are shown beneath each lane. (e) Relative antigen-driven in vitro expansion of control and FASLG-KO 1928ζ CAR-NK cells with or without ΔFAS co-expression. CAR-T cells were combined in ~1:1 ratio on day 0 and serially restimulated at indicated time points (▲) with K562-CD19 FASLG-KO cells (left panel) or left unstimulated as controls (right panel). Data displayed as the mean ratio of tEGFR+ to tLNGFR+ NK cells ± s.e.m. using n=3 biological replicates. Groups compared using a paired two-tailed Student’s T test for accumulated differences between each time point. ****P<0.0001, ns = not significant (P>0.05). (f) Cytolytic activity of FASLG-KO versus FASLG-wild type (WT) tEGFR-1928ζ CAR-NK cells against Raji/mCherry at indicated effector to target (E:T) ratios. Data shown as mean ± s.e.m. using n=3 biological replicates per condition. Statistical comparisons performed using a one-way ANOVA. ns = not significant (P>0.05), n.a. = not applicable. (g) Schematic overview of the experimental design to test the in vivo persistence of NK cells that express a 1928ζ CAR ± a FAS dominant negative receptor (ΔFAS) in Raji B-NHL bearing mice. (h) Scatter plot comparing the ratio of tEGFR+ to tLNGFR+ CAR-NK cells at the time of infusion and at indicated time points following adoptive transfer in the bone marrow of Raji B-NHL bearing mice. P-values calculated based on comparison to the infusion product using an unpaired, two-sided, Welch’s t-test. ****P<0.0001, ***P=0.0006, **P=0.0026, *P=0.0173.

