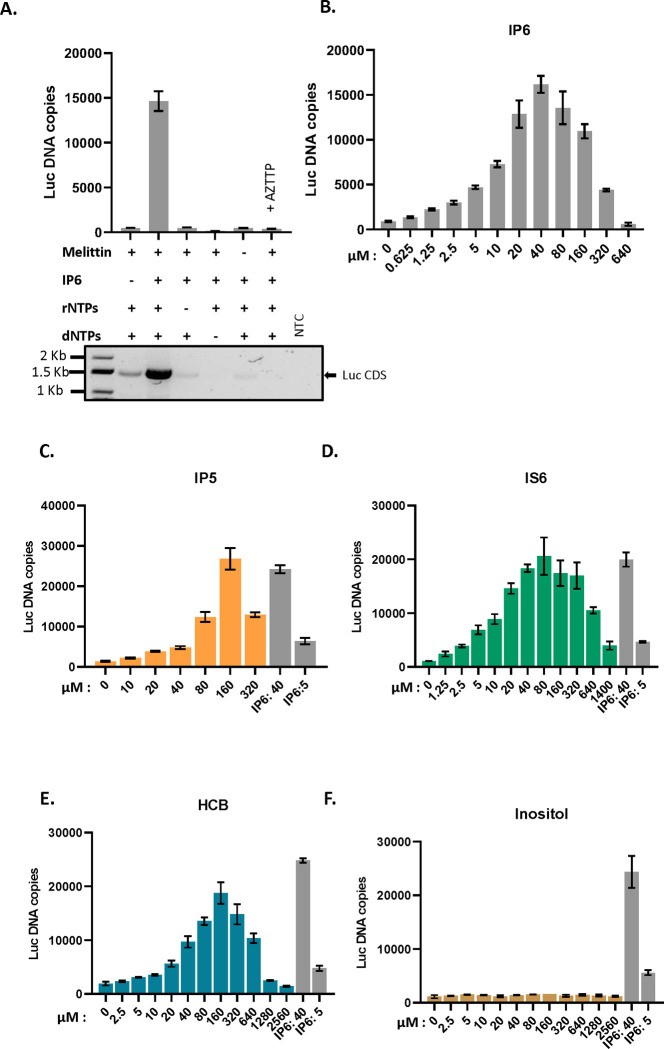
Figure 1: IP6 promotes ERT in MLV:
A) The bar graph shows ERT product formation in the presence and absence of different reagents as indicated in the x-axis of the graph. The y-axis represents absolute copies of luciferase DNA reverse transcribed from the MLV-derived luciferase vector RNA packaged in MLV. In one sample, 30 μM AZTTP was included in the reaction mixture. Below the bar graph is an agarose gel showing amplification of a longer product (luciferase coding sequence, 1500bp) after ERT. NTC- no template control for the PCR reaction. B) IP6 titration in ERT assay. The graphs represent the mean ± SD of three replicates in the qPCR measurement of a single experiment selected from at least two independent experiments with similar results. C)-F): ERT product accumulation by titrating different potential co-factors in place of IP6: C) IP5, D) IS6, E) HCB (Mellitic acid), and F) Inositol.

