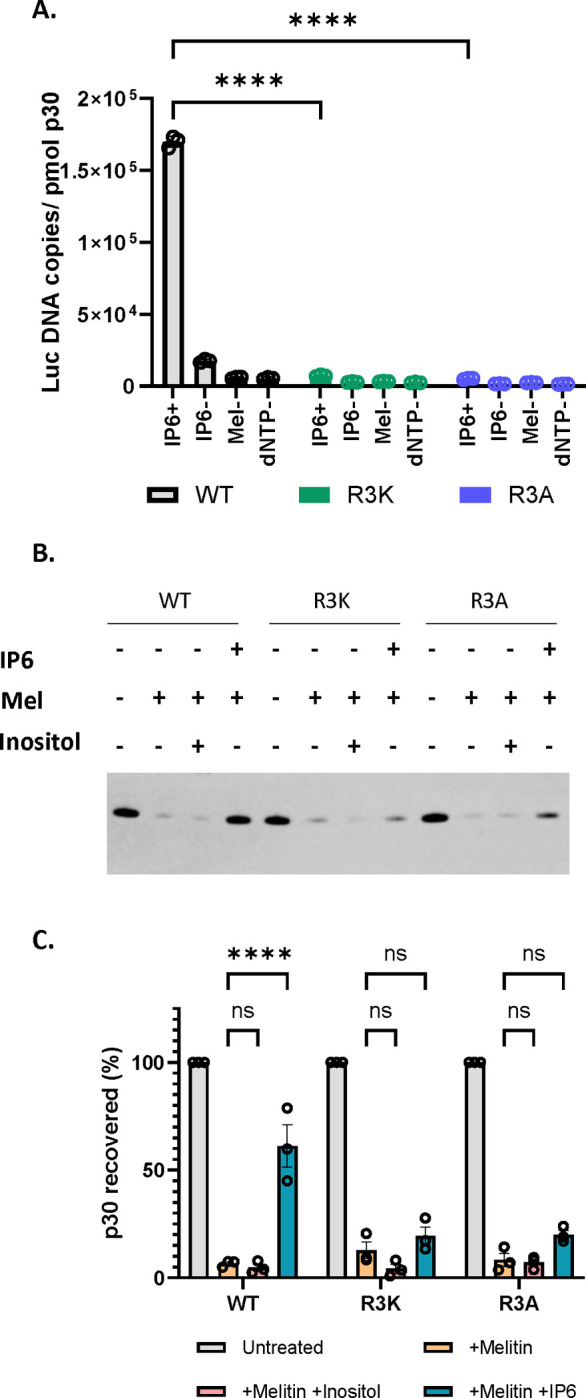
Figure 5: MLV R3 capsid mutants do not respond to IP6 in vitro.

A) The bar graph indicates the formation of ERT products in WT MLV and R3 capsid mutants of MLV with or without IP6 as indicated in the x-axis of the graph. The y-axis represents absolute copies of luciferase DNA reverse transcribed from the MLV-derived luciferase vector RNA packaged in MLV normalized to the amount of virus in each sample. B) Shown here is a representative immunoblot that was probed for MLV p30CA in viral pellets derived from WT, R3K, and R3A MLV, under conditions with or without co-factors, as indicated above the blot. The concentration of melittin used was 12.5μg/ml, and co-factors (IP6 and Inositol) were used at 80 μM. C) The bar graph shows the percentage p30CA recovery in pellets after lysis of WT, R3A, and R3K virions in the presence of the indicated co-factors.The graphs represent the mean ± SD from three independent experiments. Statistical significance is analyzed using two-way ANOVA. P values are indicated by *, **** P<0.0001, ns: not significant.
