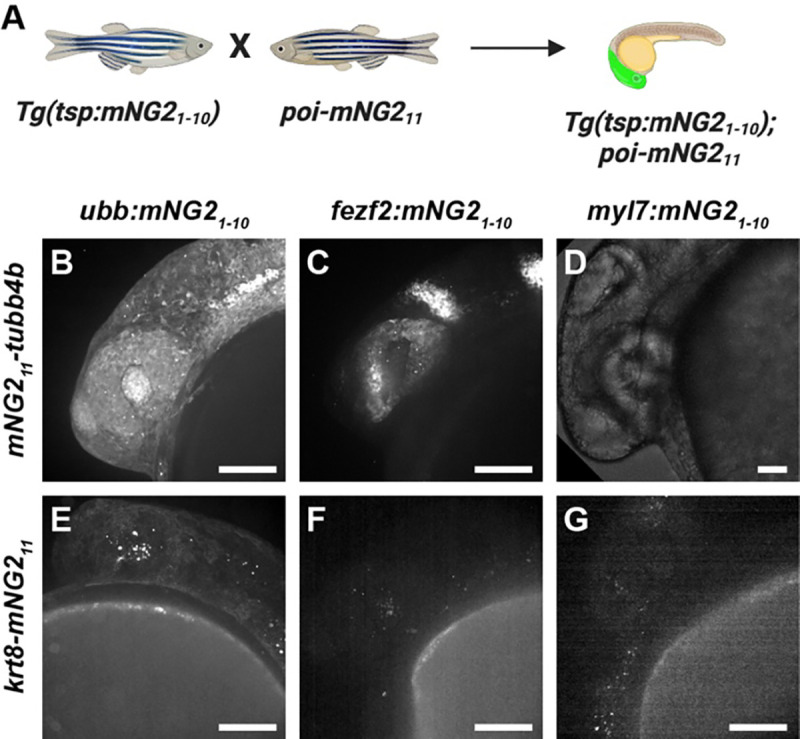
Figure 4. Combinatorial expression of tissue-specific mNG21–10 and mNG211-tagged proteins.

A. Schematic of crossing strategy. Tsp, tissue-specific promoter. poi, protein of interest. B-G. Representative images of embryos resulting from crosses between mNG211-tubb4b (B–D) or krt8-mNG211 (E–G) and ubb:mNG21–10 (B, E), fez2f:mNG2110 (C, F), or myl7:mNG21–10 (D, G). Images were acquired at 24 hours post-fertilization. Image in D has been overexposed to emphasize lack of fluorescence. Scale bars, 100 μm.
