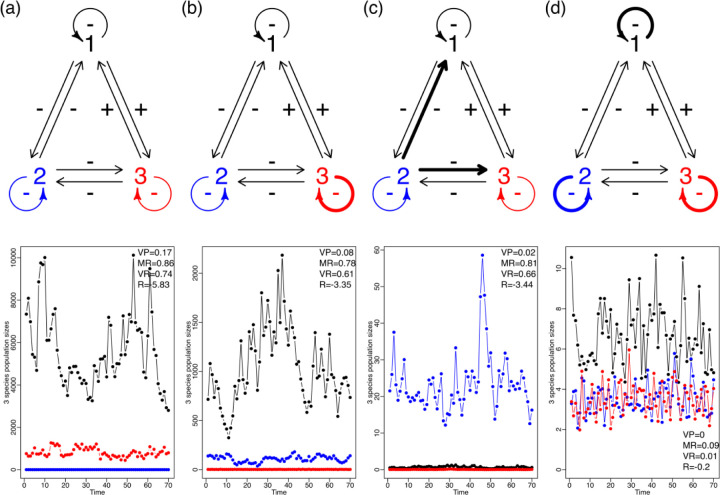
Figure 2.
This figure extends the simulation shown in Figure 1 to an instance with two or more species for 70 days. It shows that changes in the nature and intensity of community interactions directly affect the stochastic stability, measured using Ives’ et al. four stability metrics: VP,MR,VR and R which are defined and explained in the main text. In this case, the modulation of a variable environment depends on the structure, as well as the nature and intensity of the intraspecific and interspecific interactions. This figure shows the fluctuation in population sizes of four different community structures (a-d) with three species, subject to the same environmental noise regime. The upper row represents the four community structure types. The intraspecific interactions (looped arrows) and interspecific interactions (straight arrows) change in magnitude with weak interactions shown as thin arrows and strong interactions shown as thick arrows. In the row directly below each of these interaction graphs we show the resulting temporal dynamics of the abundances of each species. Since all four simulations were done under the exact same environmental noise regime the differences in magnitude and fluctuation of population abundances across community types can be directly attributed to differences in structure. From left to right, it is shown that weaker interaction strengths lead to larger fluctuations in populations under the same environmental variance. Note the different values of the Y-axis.

