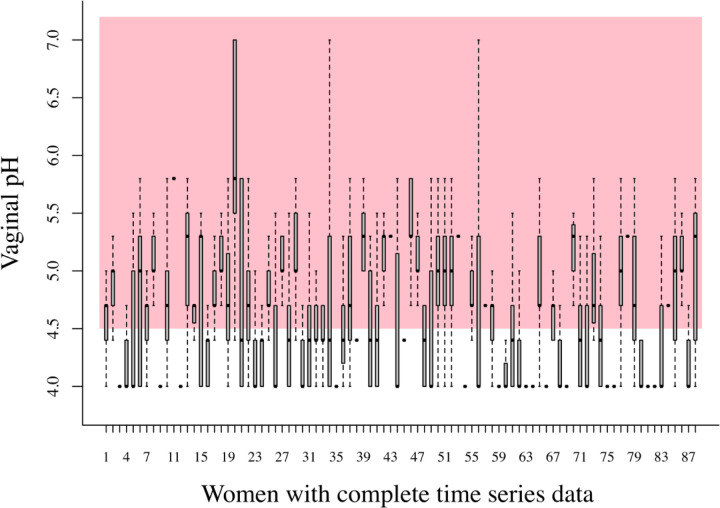
Figure 3.
Boxplots of all the pH measurements taken over 70 days for 88 women in our bacterial community time series data which were complete enough to estimate the MAR model parameters, as illustrated below. The boxplots here showcase the fact that the vaginal pH of 88 healthy, asymptomatic women varied widely over 70 days, inside and outside what is considered to be a healthy vaginal pH region (shaded pink and region < 4.5).

