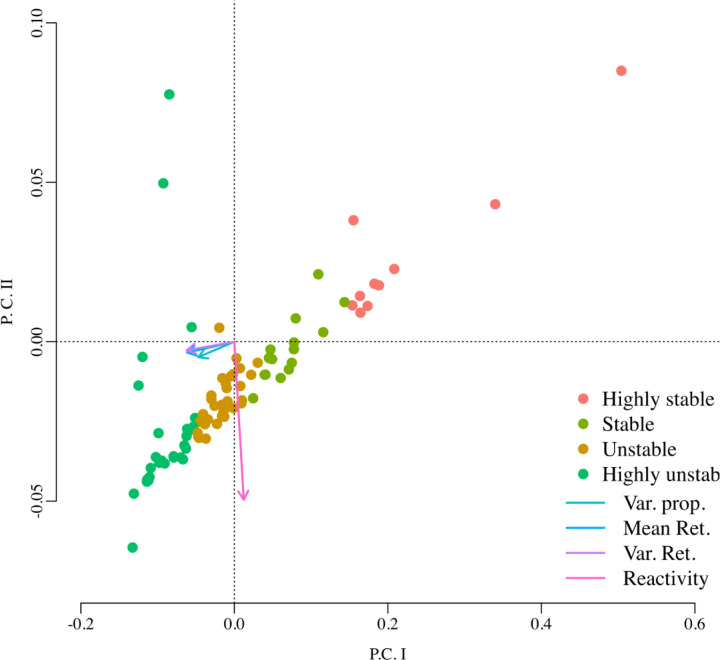
Figure 5.
Principal component analysis (PCA) performed on the four stochastic stability metrics estimated for the vaginal bacterial community time series data of 88 women. In this analysis the samples (rows) correspond to each woman and the four columns (variables in the PCA analysis) correspond to the four stability metrics estimated by fitting the MAR model of Ives et al. The arrows’ lengths and direction represent the strength of association of each one of these four metrics with the principal component axes: the variance proportion, the mean return time and the variance return time are highly associated with the first principal component while the reactivity is highly associated with the second principal component. Using k-means clustering, the PCA scores of these 88 bacterial communities were classified into four groups. Because lower values in these stability metrics indicate higher stochastic stability, an examination of the magnitude of these four metrics in each one of these four groups suggested the labeling of highly stable, stable, unstable and highly unstable dynamics (see Supplementary material for details).

