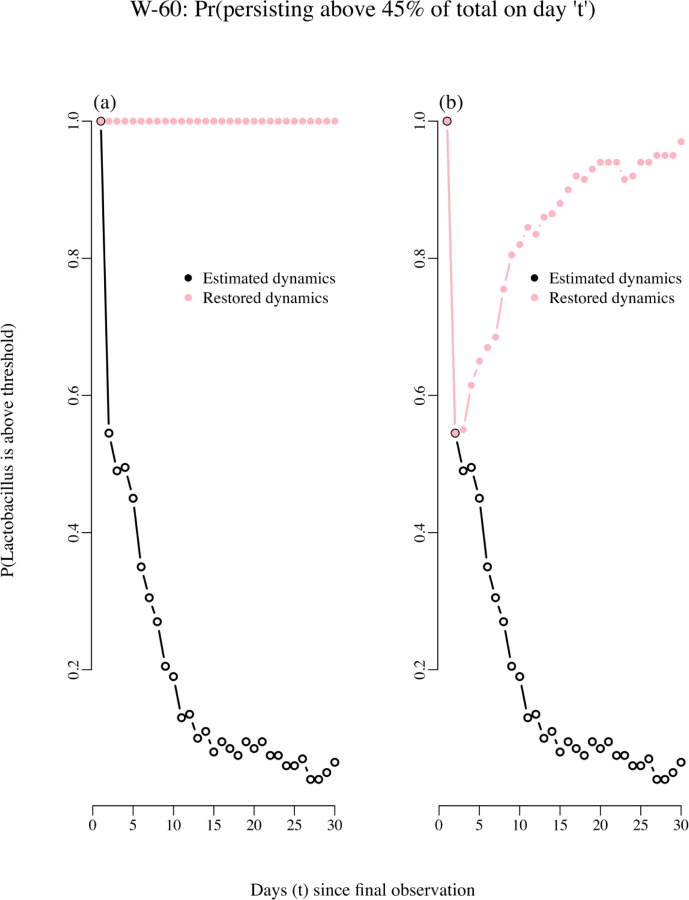
Figure 8.
Probability of persisting above 45% of total abundances “t” days into the future. As explained in the text, the changes in the estimated coefficients of the interactions matrix results in restored dynamics and persistence probabilities. In panel A the effect of Lactobacillus on non-Lactobacillus was changed from positive to negative and the effect of non-Lactobacillus on Lactobacillus was switched from negative to positive. In panel B only the maximum growth rate of the Lactobacillus species was increased by 25%.

