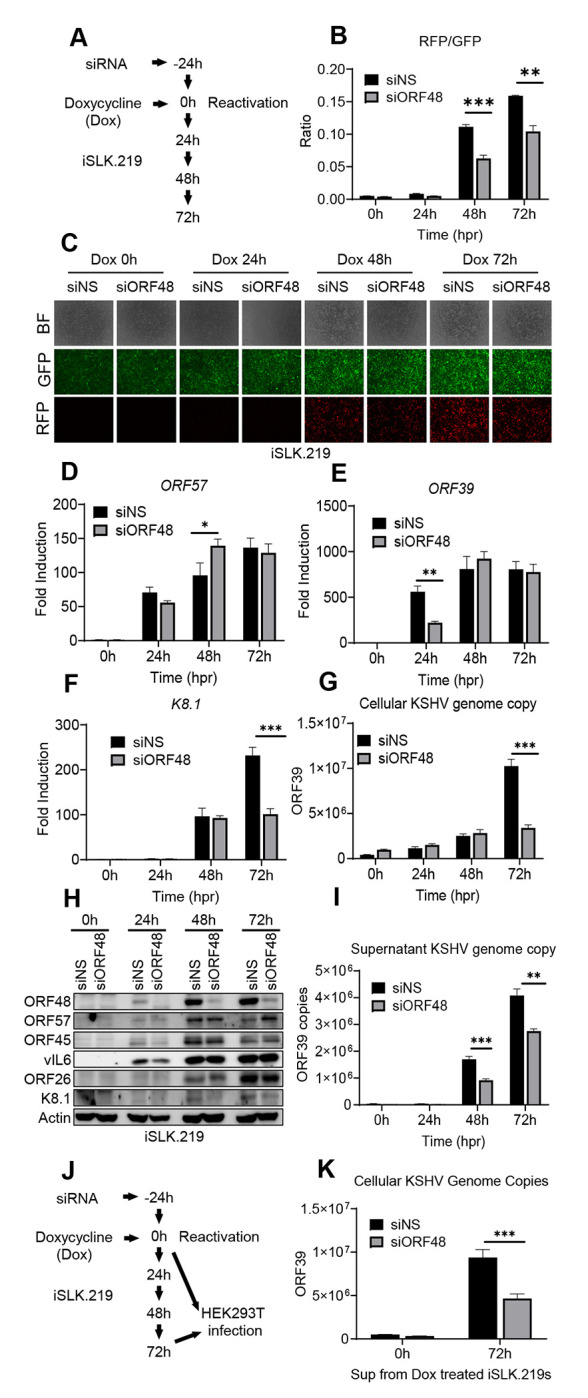
Figure 1. Knockdown of ORF48 attenuates KSHV lytic replication.

(A) Schematic illustration of the experimental procedure of (B-H). (B) The RFP and GFP fluorescence intensity were measured in groups at each time point. Briefly, a scan mold of the plate reader will read 21 spots spreading in each well to calculate the average fluorescence intensity. (C) Representative microscope image of bright field, GFP, and RFP in each group. (D-F) Total RNAs were extracted from all groups at all time points to synthesize cDNA, and subjected to RT-PCR. Specific RT-PCR primers were used to detect (D) ORF57 representing an immediate early lytic gene, (E) ORF39 representing an early lytic gene, and (F) K8.1 representing a late lytic gene. Expression levels of these genes were normalized with GAPDH. (G) Cellular KSHV genome copies were quantitated using a genomic primer based on the ORF39 coding sequence as previously described. A STREP-tagged ORF39 (37) was used to generate the standard curve. (H) Western blot analysis of ORF57, vIL6, and ORF45 (immediate early or early stage); ORF26 and K8.1 (late stage). (I) The supernatants from all groups containing KSHV genome copies were quantitated using the same method as (G). (J) Schematic illustration of the experimental procedure of infection assay. Briefly, the supernatants from 72h groups were collected to infect naïve HEK293T cells to evaluate infectious virion productions from each group. Zero-hour groups served as a negative control for infection. (K) Forty-eight hours post-infection, genome DNAs from infected HEK293 cells were extracted and the KSHV genome copy numbers were evaluated by the same method as (G). Data are presented as mean ± s.d. from at least three independent experiments. *indicates p<0.05. ** indicates p<0.01 *** indicates p<0.001 **** indicates p<0.0001 by Student’s t-test.
