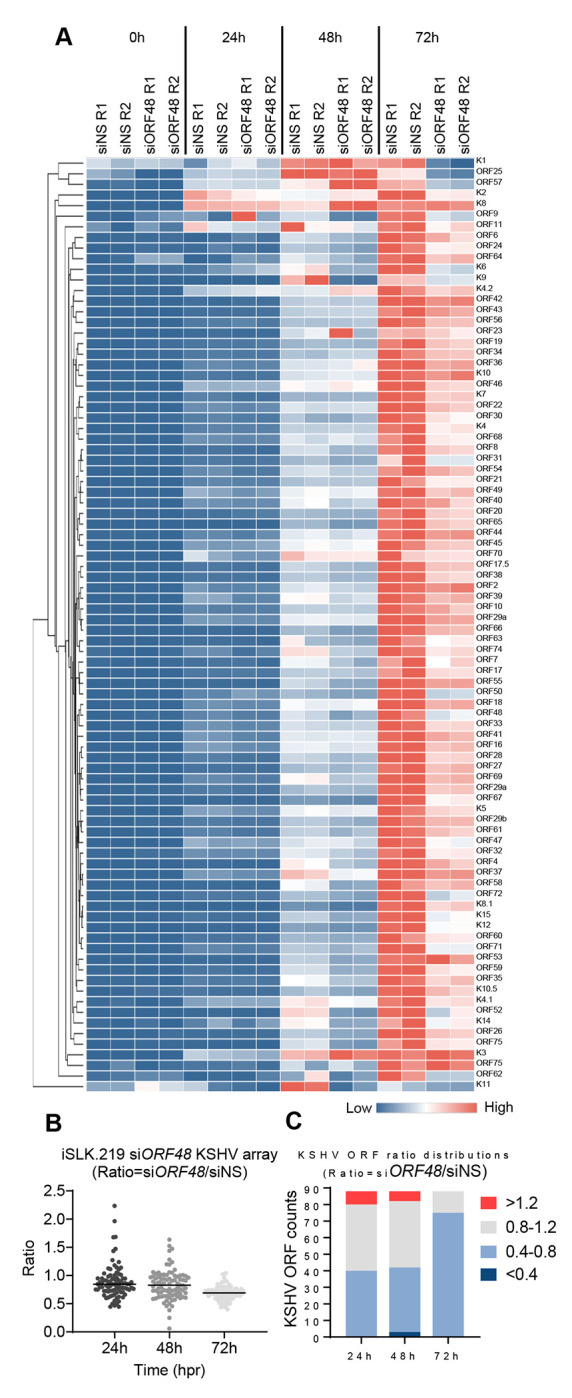
Figure 2. Knockdown of ORF48 inhibits KSHV lytic gene transcription.

(A) iSLK.219 transfected with siNS or siORF48 treated as described in the text and Figure 1A. A real-time qPCR-based KSHV transcriptome array was performed. Higher transcript expression levels are indicated by red and lower expression levels by blue as shown in the key. (B) For each KSHV ORF at 24h, 48h, and 72h time points, the average expression level of two biological replicates of siORF48 was normalized to their siNS controls to generate a ratio. The plot depicts summary statistics and the density of each KSHV ORF from each group, and each dot represents one of the eighty-eight KSHV ORFs. (C) The distribution of KSHV ORF ratios in each group was further categorized into upregulated (>1.2), unaffected (0.8-1.2), downregulated (0.4-0.8) and highly downregulated (<0.4).
