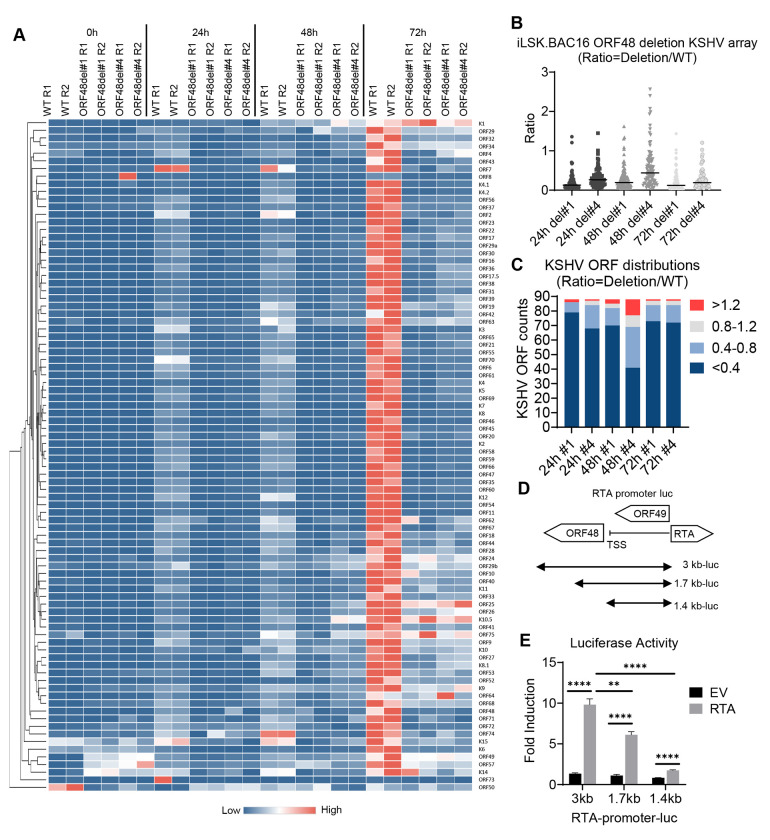
Figure 5. ORF48 genome deletion causes global KSHV ORF transcriptional repression.
(A) iSLK. BAC16 WT, ORF48del#1 and ORF48del#4 cells were treated as described in the text and Figure 3A, and subject to the KSHV transcriptome array as described in Figure 2A. Higher transcript expression levels are indicated by red and lower expression levels by blue as shown in the key. (B) The average expression level of two biological replicates of ORF48del#1 or ORF48del#4 was normalized to their WT controls to generate a ratio. The plot depicts summary statistics and the density of each KSHV ORF from each group, and each dot represents one of the eighty-eight KSHV ORFs. (C) The distribution of KSHV ORF ratios in each group was further categorized into upregulated (>1.2), unaffected (0.8-1.2), downregulated (0.4-0.8) and highly downregulated (<0.4). (D) Schematic diagram of RTA-promoter constructs. The 3 kb, 1.7 kb, and 1.4 kb upstream of the RTA coding sequence were cloned into the upstream of the firefly luciferase reporter. (E) The RTA-promoter constructs and a CMV-renilla luciferase construct were co-transfected with pCDNA-FLAG-RTA plasmid or empty vector control into HEK293T cells. Forty-eight hours later, cells were harvested, lysed, and subjected to a Dual-luciferase assay. Firefly/Renilla ratios were generated in each group and all groups were then normalized to their EV control group respectively to generate fold induction. Data are presented as mean ± s.d. from at least three independent experiments. *indicates p<0.05. ** indicates p<0.01 *** indicates p<0.001 **** indicates p<0.0001 by Student’s t-test.

