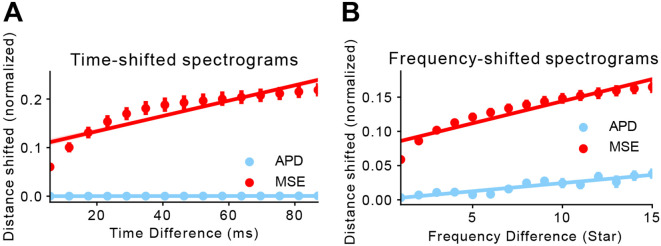
Fig 3. Perceptual loss is more robust to small changes than pixel-wise loss.
We measure the distance between two time/frequency-shifted spectrograms using MSE and APD, and compare the trajectories of both distance metric as shifting becomes more significant.Both MSE and APD measurements have been normalized so that the maximum and minimum achievable distances are 1 and 0, respectively. A) Distance measured between two time-shifted spectrograms. We start with a pair of spectrograms separated by 5ms (leftmost points) and progress at a step size of approximately 5ms. We then calculate MSE and APD between each pair and fit a linear regression to all the points within either distance metric. B) Distance measured between two frequency-shifted spectrograms. Similarly, we start with a pair of spectrograms separated by 1 STAR (leftmost points) and progress at a step size of 1 STAR.

