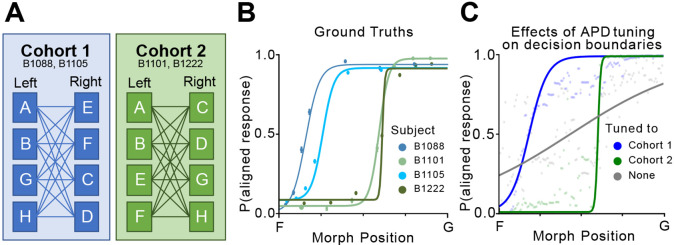
Fig 5. Fine-tuning realigns the model to a specific aspect of perception.
A) Training schemes of two cohorts in the original experiment. Refer to [26] for a detailed description of the training process. Results from cohort 1 and 2 are shown with blue hues and green hues respectively in this figure. B) Behaviorally measured psychometric curves on morph stimuli between F and G. Each curve corresponds to a test subject in cohorts 1 and 2. C) APD-generated psychometric curves on morph stimuli between F and G. We compare results from APD models tuned on cohorts 1 and 2, as well as APD without fine-tuning (shown in gray).

