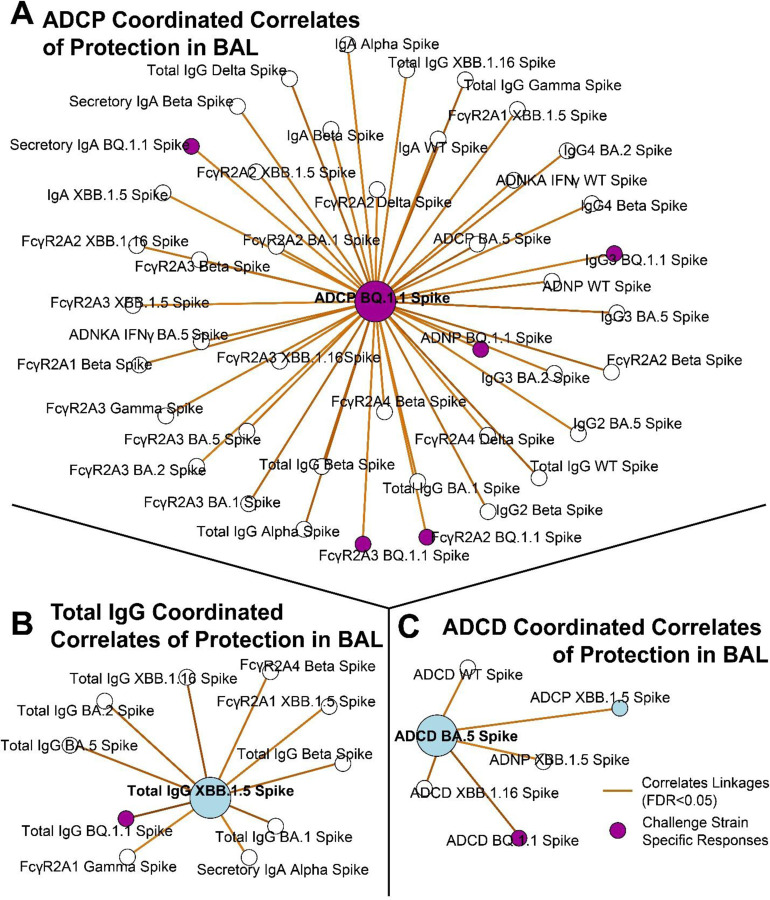
Figure 2. Antibody network of strongest correlates of protection in the BAL.
(A) ADCP to the challenge strain BQ. 1.1 Spike (purple node) was centered and correlating antibody features (R >0.6, FDR p-value <0.05) taken from the BAL are shown.
(B) Same as A, but for total IgG to XBB. 1.5 Spike.
(C) Same as A, but for ADCD to BA.5 Spike. Blue circles correspond to the selected features in Figure 1. Purple circles correspond to BQ.1.1 Spike, which was the challenge strain. Legend is shown at the bottom right.

