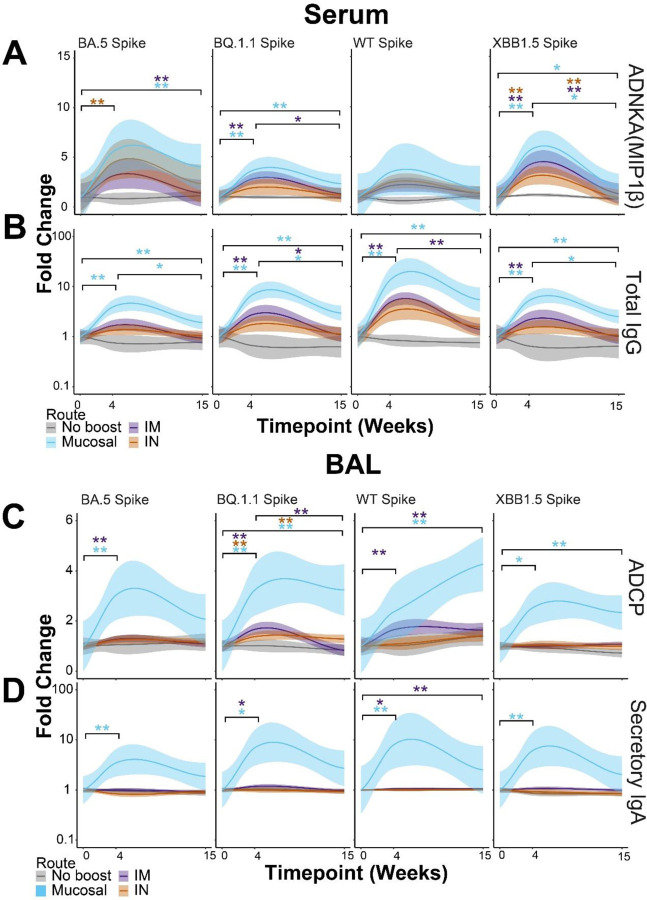
Figure 3. Mucosal boosting enhances serum and lower respiratory tract humoral responses to various SARS-CoV2 VoCs.
(A) Post-booster fold enhancements of serum-resident antibody-dependent natural killer cell activation (ANDKA) to the indicated Spike variants as quantified by macrophage inflammatory protein 1 beta (MIP1β) production. ADNKA was selected as a key correlate of protection in Figure 1.
(B) Same as A, but for the serum-resident networked feature of total IgG to the indicated Spikes variants. Color scheme legend is shown at the bottom for the serum responses.
(C) Post-booster fold enhancements of BAL-resident antibody-dependent cellular phagocytosis (ADCP) by monocytes to the indicated Spike variants. ADCP was selected as a key correlate of protection in Figure 1.
(D) Same as C, but for the BAL-resident networked feature of secretory IgA to the indicated Spike variants. Color scheme legend is shown at the bottom for the BAL responses. For all plots, fold enhancements were relative to the mean value of the group at the pre-boost time point, week 0. Shown here are the best-fit models of matched responses within 95% CI in regions shaded in corresponding colors. * = p < 0.05, ** = p < 0.01; Wilcoxon Test followed by FDR correction.

