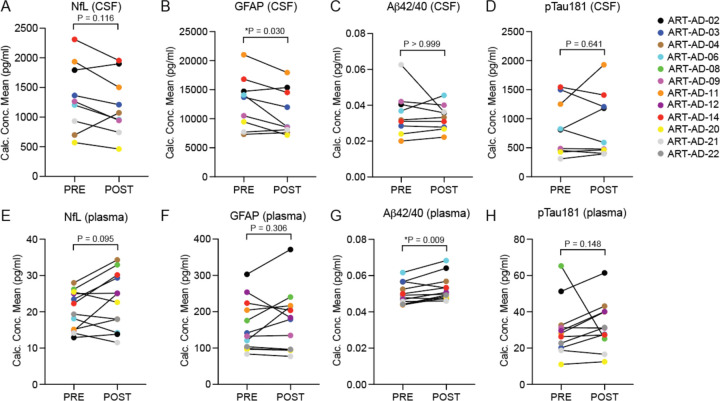
Figure 1 |. Quantification of biomarkers associated with neurodegeneration in CSF and plasma.
Quanterix was used to detect the indicated proteins in CSF (A-D) and plasma (E-H) of participants at baseline and after 24 weeks of 3TC treatment. CSF, N=9; Plasma, N=12. Normality testing was based on the POST-PRE difference for each target; P values are based on two-sided paired sample t-test (normal distribution) or Wilcoxon matched-pairs signed rank test (non-normal distribution).

